


Bicyclist and Light Mobility
Road safety is a critical issue which needs to be addressed to ensure that bicycling and light mobility options can continue to support new and greener mobility choices. Bicycles and light mobility vehicles do not have the same in-built protection large vehicles have. Therefore, safe infrastructure is critical.
In many places, the rate of fatal and serious injury (FSI) crashes involving bicyclists and light mobility users is increasing, often while the trend of overall traffic FSI crashes is decreasing. For example, serious injuries in Sweden resulting from bicycle crashes has increased by approximately 35 percent over the past 10 years, while serious injuries for all other crash types fell.
This trend is reflected in places across the world and reflects the steep increases in the use of bicycles and other light mobility vehicles in cities globally. Rapid changes in technologies (such as electric-powered vehicles), service providers (such as bicycle food delivery) and the sharing economy are contributing factors.
Research shows that the chances of a bicyclist surviving an impact with a motorised vehicle reduces dramatically above 30 km/h, and even at lower speeds than this, serious harm can be caused, especially to elderly or child pedestrians.
Bicycles require less to be spent on road infrastructure than heavier, larger vehicles. Cycling is an environmentally-friendly and healthy activity. It also supports equitable and affordable access to transport for low-income citizens. However, safe infrastructure is critical to increasing cycling participation – particularly that of women, young people and the elderly.
Vehicle impact crashes
Crashes between vehicles and bicycles result in the highest injury severity and fatalities due to the relative weight and speed of a vehicle.
Typical factors which may add to vehicle impact crash risk include:
- Unsafe traffic speeds
- Inadequate or poorly designed bicycle facilities
- Poor intersection and property access design
- Two-way bicycling facilities
- Multi-lane roads
- Presence of heavy vehicles
- Narrow or no paved shoulders on rural roads
- Poor visibility and lighting
- Vehicle parking
Crashes between bicyclists/light mobility users
As new bicycle and light mobility technologies become available, there is a greater range of operating speeds, light vehicle size and weight. Further, where such technologies have led to a large uptick in bicyclists and light mobility users, many facilities are not sufficient to meet demand which leads to congestion on the facility and more bicyclists and light mobility users using regular traffic lanes.
Typical factors which may add to risk of crashes between bicyclists/light mobility users include:
- Poor facility surface, obstacles (such as parked vehicles) and width restrictions.
- High bicycle/light mobility flows.
- Narrow and/or two-way bicycling facilities.
- Large differences in speed or weight of vehicles.
- Downhill grade.
- Sharp corners.
- Poor visibility and lighting.
Crashes with pedestrians
Bicycle and pedestrian facilities are often co-located or shared which increases the risk of conflicts, especially where there has been an increase the use of faster, less manoeuvrable and/or heavier 2- and 3 wheelers (e.g. mopeds or cargo bikes).
Typical factors which may add to risk of crashes with pedestrians include:
- Sidewalks and shared paths.
- Downhill grade.
- High bicycle/light mobility flows.
- Poor design or placement of bicycling facilities (e.g. bus stops).
- Poor intersection design/configuration.
- Poor visibility and lighting.
Single bicycle/light mobility crashes
Hospital data studies consistently show that 60 to 90 percent of bicycle crashes requiring hospitalisation—and approximately 17 percent of fatal bicycle crashes—are the result of single bicycle crashes (i.e. they do not involve a direct conflict with a motor vehicle, another bicycle/light vehicle or person).
Typical factors which may add to risk of single bicycle crashes include:
- Slippery surface conditions (leaves, ice, snow, water, cross-fall).
- Tram or train rails.
- Other surface obstacles (such as drain openings) or deformation (such as caused by tree roots).
- Downhill grade and sharp corners.
- Severe side hazards (such as rivers, canals or cliffs).
- Poor intersection design/configuration.
- Poor visibility and lighting.
| Name | Cost rating | Effectiveness |
|---|---|---|
| Bicycle Facilities | Low to Medium | 25 – 40% |
| Central Hatching | Low | 10 – 25% |
| Central Turning Lane Full Length | Low | 10 – 25% |
| Lane Widening | Medium to High | 25 – 40% |
| Parking Improvements | Low to Medium | 10 – 25% |
| Regulate Roadside Commercial Activity | Low to Medium | 10 – 25% |
| School Zones | Low to Medium | 10 – 25% |
| Service Road | High | 25 – 40% |
| Paved Shoulder | Medium | 25 – 40% |
| Sight Distance (obstruction removal) | Low to Medium | 25 – 40% |
| Speed Management | Medium | 25 – 40% |
| Street Lighting | Medium | 10 – 25% |
| Traffic Calming | Medium to High | 25 – 40% |
| Name | Cost rating | Effectiveness |
|---|---|---|
| Addressing Alcohol and Other Drugs | – | – |
| Child Safety Initiatives | – | – |
| Education | – | – |
| Enforcement | – | – |
| Helmets and Protective Clothing | – | – |
| Publicity | – | – |
| Safe Speed | – | – |
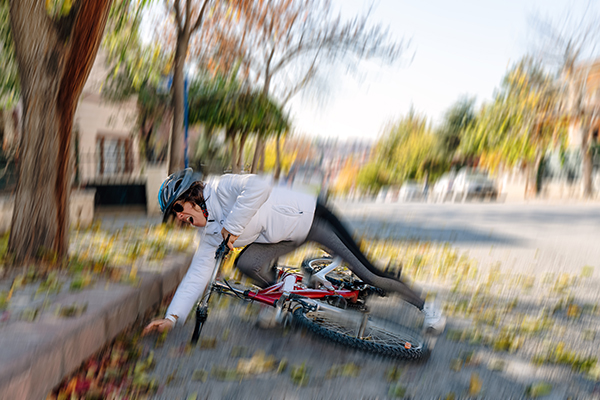 A bicycle crash. Image credit: iStock
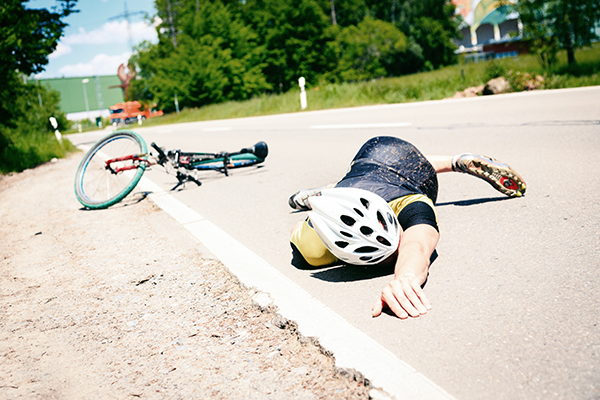 A bicyclist wearing a helmet in a crash. Image credit: iStock
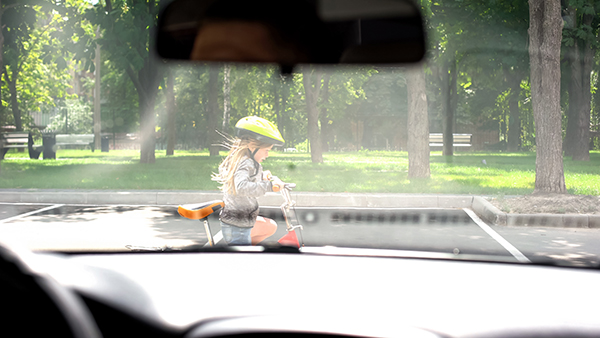 A child bicyclist wearing a helmet in a potential crash. Image credit: iStock
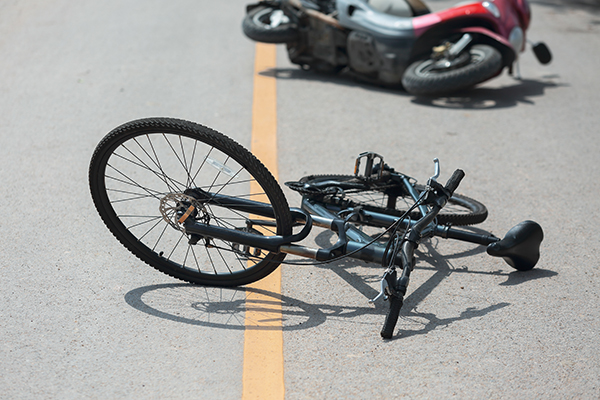 A crash involving a bicycle and moped. Image credit: iStock
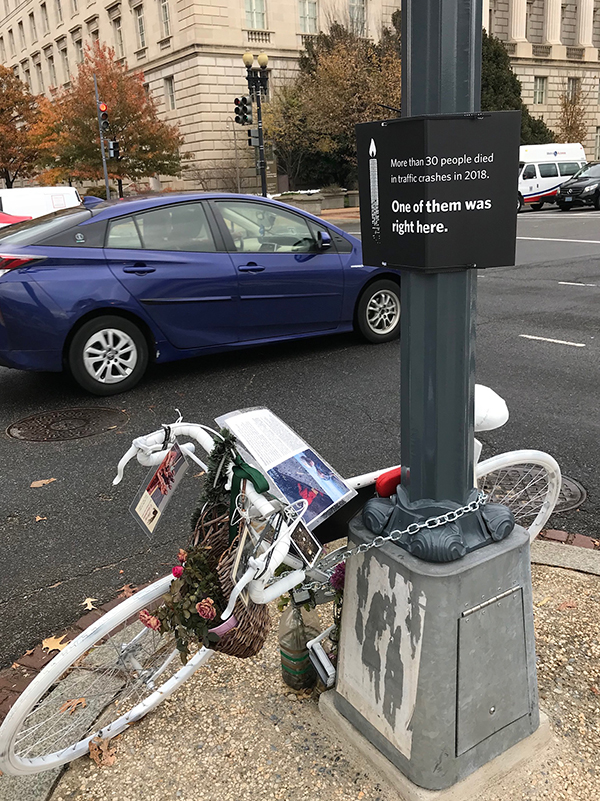 Bicyclist fatality - Washington DC, USA. Image credit: iStock
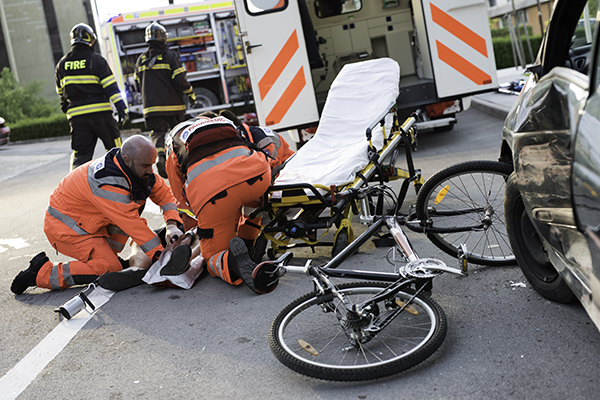 Emergency response to a crash involving a bicycle and a car. Image credit: iStock
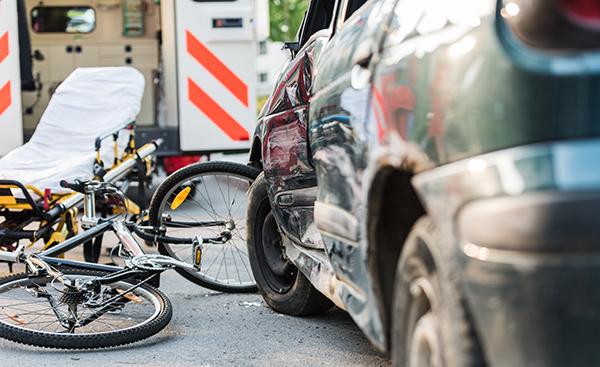 Emergency response to a crash involving a bicycle and a car. Image credit: iStock
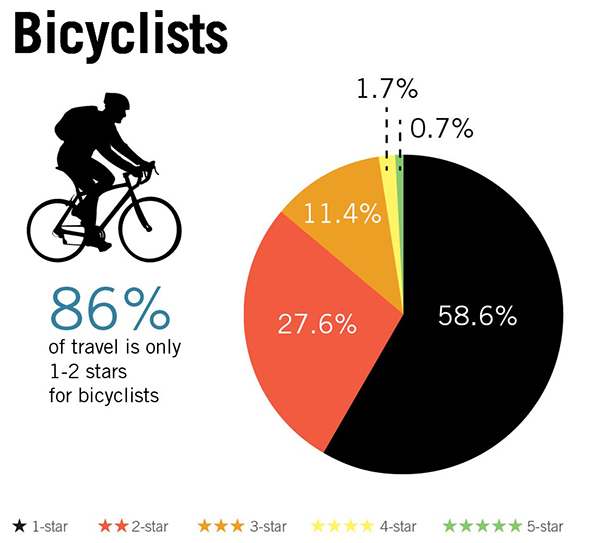 Bicyclist Star Ratings by road user type based on a 358,000km sample of roads across 54 countries. Image credit: iRAP
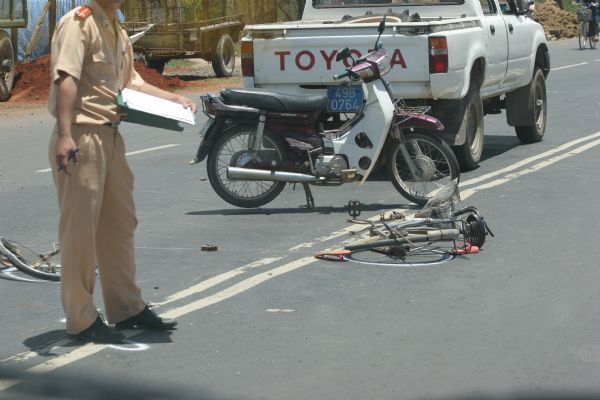 The result of a vehicle-cyclist crash. Image credit: Cao Hoang Can, Vietnam Road Administration


