


Bicyclists and Light Mobility
Bicycling is a sustainable form of transport with a long history that pre-dates the rise of car travel in many places throughout Europe, Asia and the Americas. Today, bicycling is being promoted as an active and healthy form of transport which reduces urban congestion, improves air quality and liveability, and significantly reduces the need for capital investment and maintenance costs for the infrastructure required to support it.
Across the world, bicycling and other forms of light mobility have seen steep increases in recent years, even where bicycling has not traditionally been a popular mode of transport. This is due to in part to rapid changes in technologies (such as electric-powered bicycles and scooters), service providers (such as bicycle food delivery), the sharing economy and supportive policies and infrastructure investment.
The rise of new economies (such as food delivery apps and ride share) are also leading to changes in how bicycling infrastructure is being used, by whom and at what time of day. For example, many cities have not only experienced exponential growth in users, but are also observing changes to the types and speeds of vehicles using facilities, as well to flows at different times of day (primarily in the evening).
The ITF categorises ‘micro-vehicles’ by speed and weight:
- Type A and Type B micro-vehicles include human-powered vehicles such as bicycles, as well as vehicles whose power supply cuts off at 25 km/h.
- Type C and Type D micro-vehicles include battery or motor-powered vehicles such as e-bikes and mopeds capable of speeds up to 45km/h.
Type A: Pedal bicycles and standing e-scooters
Based on the data available, there is no significant difference in the fatality risk of a normal cycling trip and a standing e-scooter. However, studies into injuries and their severity show differences between vehicle types, notably, that e-scooter riders involved in crashes have higher rates of concussion injuries, whereas e-bike riders suffer more internal injuries and conflicts with pedestrians than riders of regular bicycles involved in crashes.
Type B: Cargo bicycles and low-speed mobility vehicles
Cargo bicycles are becoming increasingly common in popular cycling regions in Europe; however, no research could be located on the risk of fatalities or serious injuries related to these bikes in these regions, possibly as they are still used in relatively low numbers. These bikes are large, but tend to be slower and less manoeuvrable compared to a standard bicycle. From this, it could be reasonably expected that conflict with other users and objects might be higher and that injury rates to other users may be greater (due to its greater mass).
Evidence of trishaws in India suggests that the both the riders and passenger of these bikes themselves are particularly vulnerable to conflict with motor vehicles and other higher-speed LV users (in particular, motorbikes) resulting in severe injuries, often to the head.
A review of injury data related to the use of low-speed mobility vehicles (or ‘scooters’) by the elderly or disabled in Australia found that most injury crashes related to falls on paths or streets and collisions with vehicles, and that rates of injury severity and fatalities were strongly linked with the user’s age and ability.
Type C: Higher speed electric bicycles
After conventional bicycles, ‘e-bicycles’ are the next most common vehicle being used in many regions. The U.S. e-bicycle model definitions that have been adopted by the US Bicycle Products Supplier Association were developed around a three-class system (and all of which fall within the ITF’s Type C category) to assist with the regulation of their use:
- Class 1: Pedal assist only, maximum assisted speed 20 mph (32 km/h)
- Class 2: Throttle controlled, maximum assisted speed 20 mph (32 km/h)
- Class 3: Pedal assist only, maximum assisted speed 28 mph (45 km/h)
In the US, there has been a sharp increase in e-bicycle injury crashes since 2012 (which corresponds to the increase in e-bicycle ownership over the same time) however, there is no evidence to suggest that these bicycles, by their nature, are more likely to be involved in crashes or result in higher levels of severity, although injury reporting by e-bicycle category is not yet routine. Where higher rates of crashes are observed, increased risk may be due to:
- Greater exposure of the bicyclist due to cycling habits (i.e. people tend to use e-bicycles to take longer, more regular trips)
- The age of the rider, and in particular, the growing preference among older people to use e-bicycles
- The relative quality of bicycling infrastructure. This could be particularly evident where e-bicycles result in a sudden uptick of new users on deficient facilities.
Type D: Mopeds
Mopeds are lower speed motorcycles or typical “e-bike” common in China. They often exist regulatory ‘grey’ area between full-powered motorcycles and bicycles. In some places, mopeds typically use bicycling facilities (where present) rather than the road lane. In Southeast Asia, it is common for these bikes to have their own motorcycle facility. These vehicles are associated with much higher levels of fatalities and severe injuries due to their speed and mass.
Case Studies
| Name | Cost rating | Effectiveness |
|---|---|---|
| Bicycle Facilities | Low to Medium | 25 – 40% |
| Central Hatching | Low | 10 – 25% |
| Delineation | Low | 10 – 25% |
| Intersection – Signalise | Medium | 25 – 40% |
| Lane Widening | Medium to High | 25 – 40% |
| Parking Improvements | Low to Medium | 10 – 25% |
| Pedestrian Fencing | Low | 25 – 40% |
| Regulate Roadside Commercial Activity | Low to Medium | 10 – 25% |
| Restrict/Combine Direct Access Points | Medium to High | 25 – 40% |
| Road Surface Rehabilitation | Medium | 25 – 40% |
| School Zones | Low to Medium | 10 – 25% |
| Paved Shoulder | Medium | 25 – 40% |
| Sight Distance (obstruction removal) | Low to Medium | 25 – 40% |
| Speed Management | Medium | 25 – 40% |
| Street Lighting | Medium | 10 – 25% |
| Traffic Calming | Medium to High | 25 – 40% |
| Name | Cost rating | Effectiveness |
|---|---|---|
| Addressing Alcohol and Other Drugs | – | – |
| Education | – | – |
| Emergency Response | – | – |
| Enforcement | – | – |
| Helmets and Protective Clothing | – | – |
| Publicity | – | – |
| Safe Speed | – | – |
Related Images
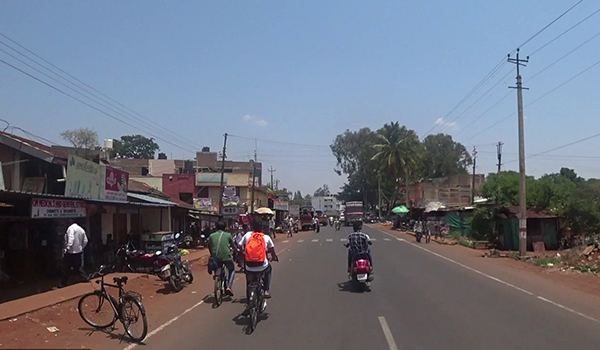 Bicyclists on state highway in India. Image credit: iRAP
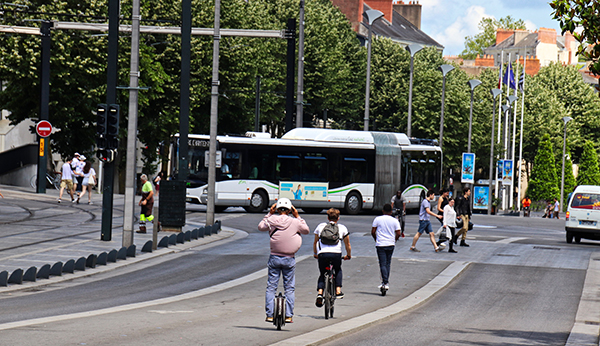 Various road users. Photo credit: RdA Suisse
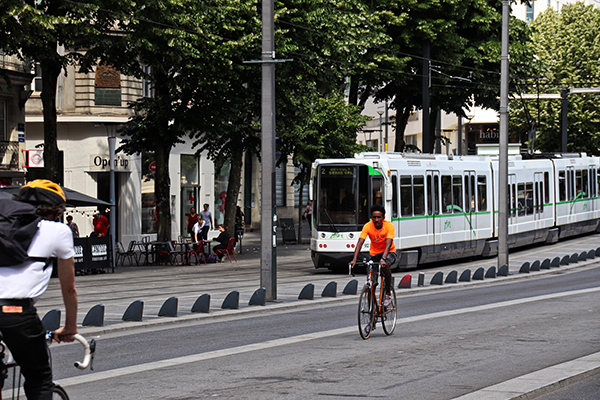 Bicyclists. Photo credit: RdA Suisse
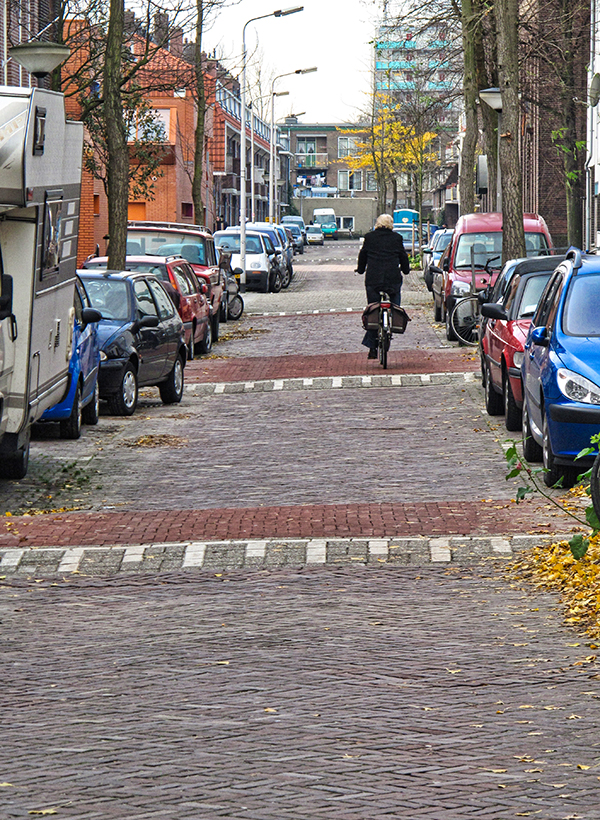 Traffic calming example. Photo credit: RdA Suisse
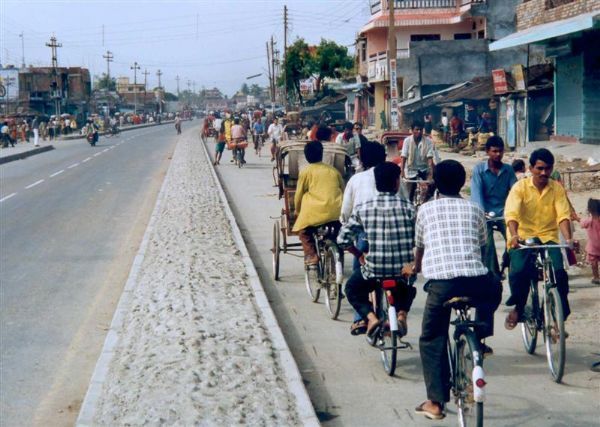 A dedicated off-road bicycle lane with >1m separation from traffic lane. Image credit: Unknown
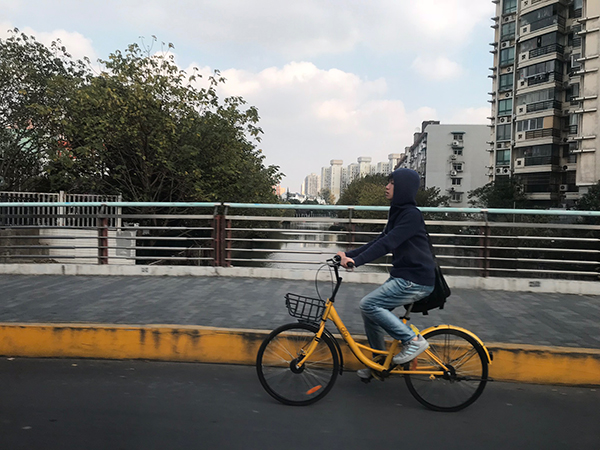 A bicyclist. Image credit: iRAP
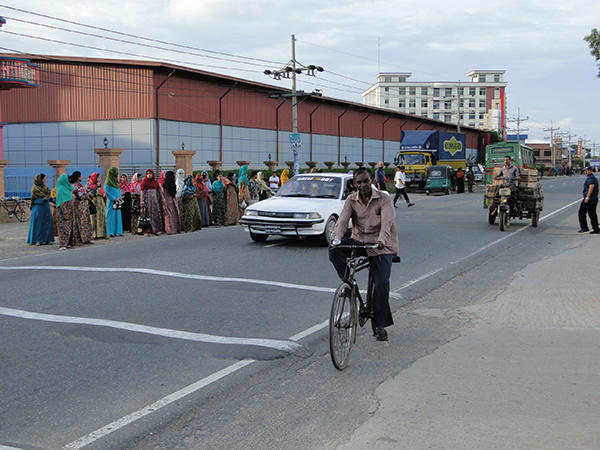 A bicyclist in Bangladesh. Image credit: Greg Smith
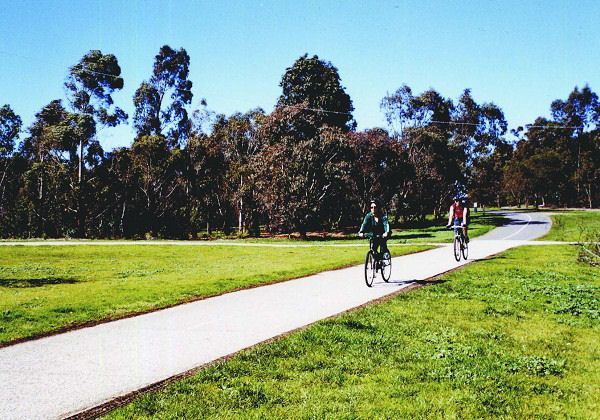 Exclusive bicycle lane. Image credit: Unknown
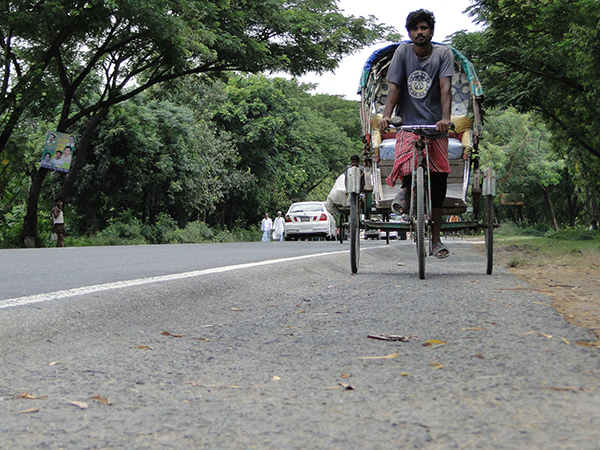 A rickshaw in Bangladesh. Image credit: Greg Smith
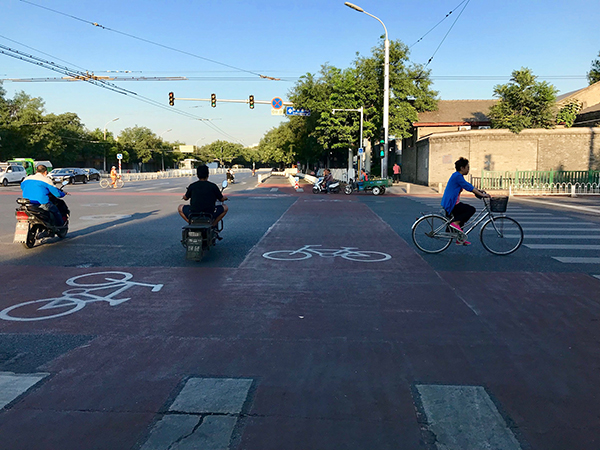 Bicycle crossing in Beijing, China. Image credit: iRAP
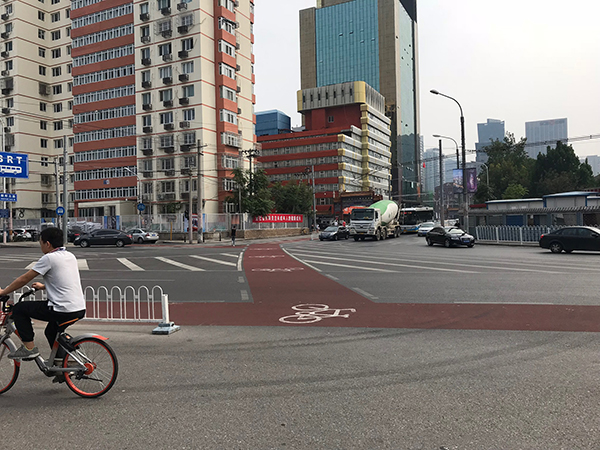 Bicycle crossing in Beijing, China. Image Credit: Greg Smith
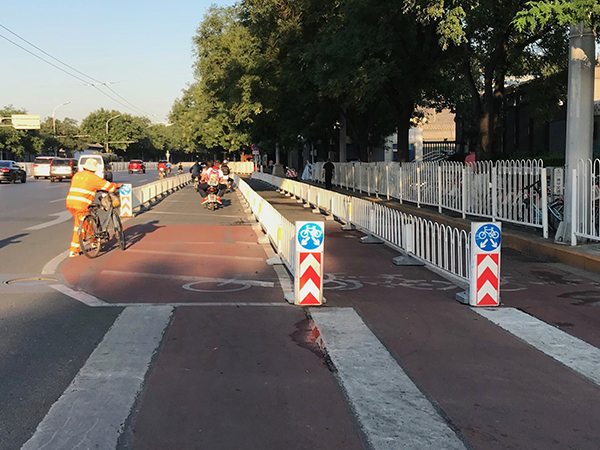 Bicycle facility in Beijing, China. Image credit: iRAP
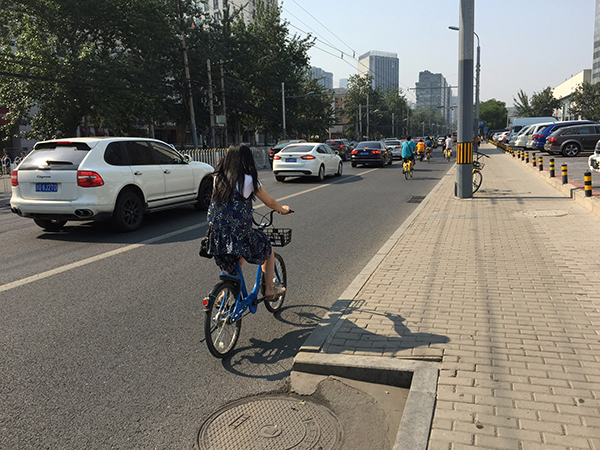 Bicycle facility in Beijing, China. Image credit: iRAP
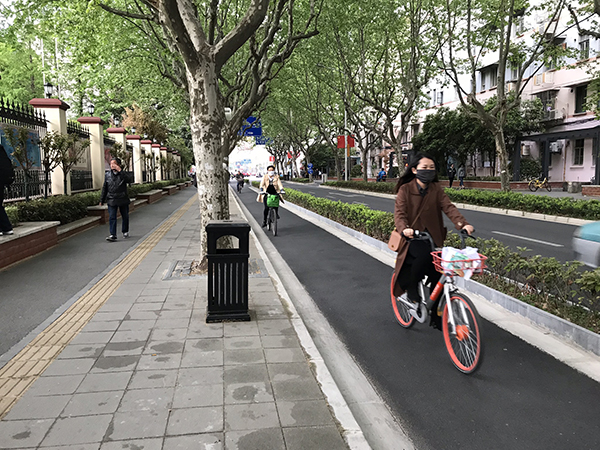 Bicycle lane and sidewalk in China. Image credit: WRI
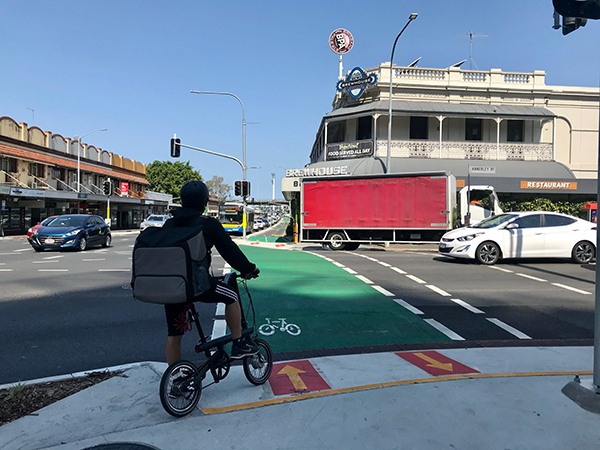 Bicycle lane, Australia. Image credit: Unknown
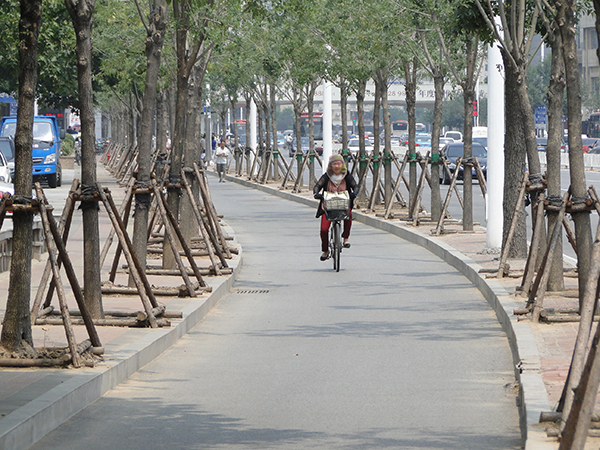 Off -road bicycle lane in China. image credit: Greg Smith
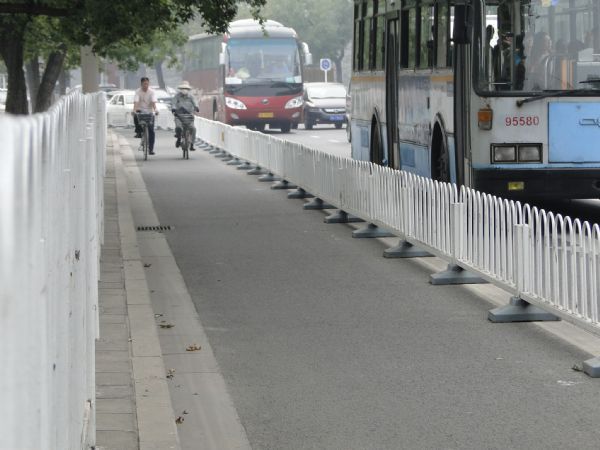 Bicycle lane, Beijing, China. Image credit: Greg Smith
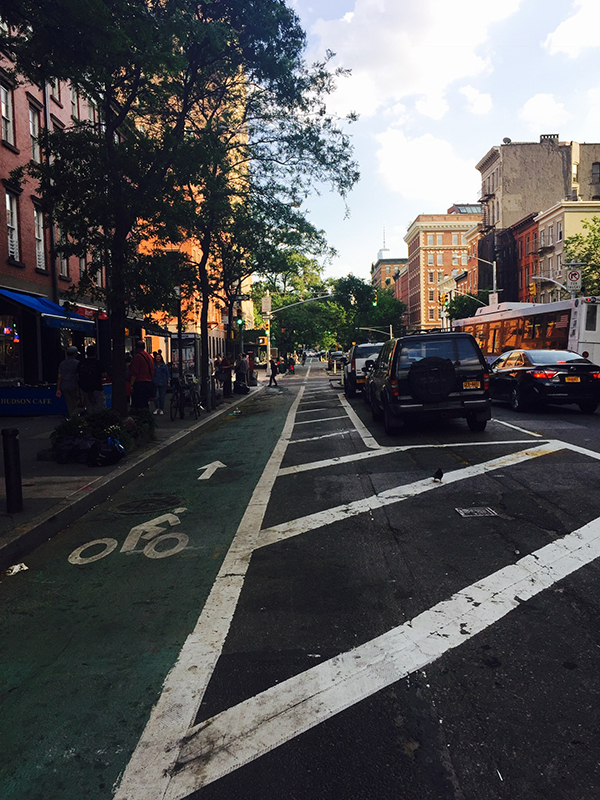 Bicycle lanes, USA. Image credit: Unknown
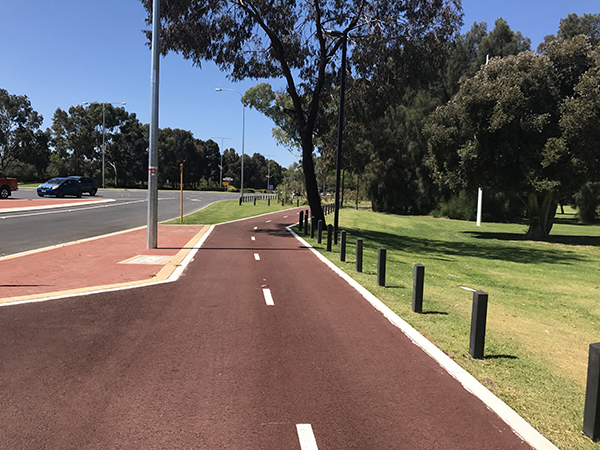 Off-road bicycle path, Australia. Image credit: Alina Burlacu
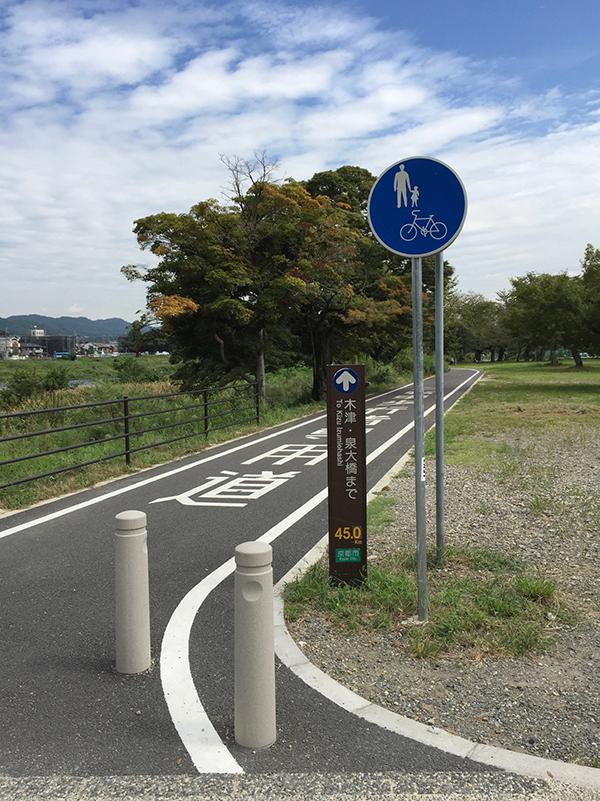 Bicycle path, Japan. Image credit: Unknown
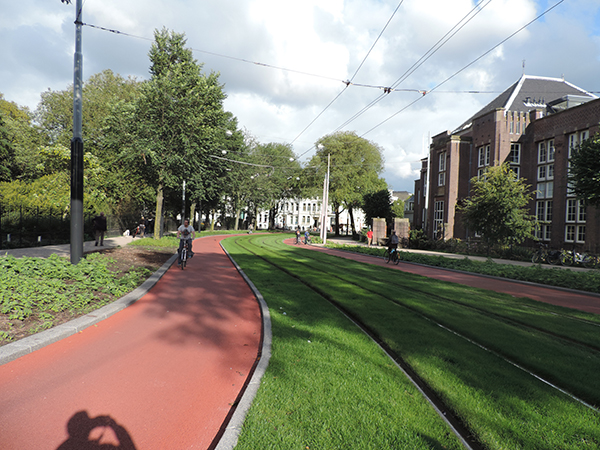 Bicycle path, Netherlands. Image credit: Alina Burlacu
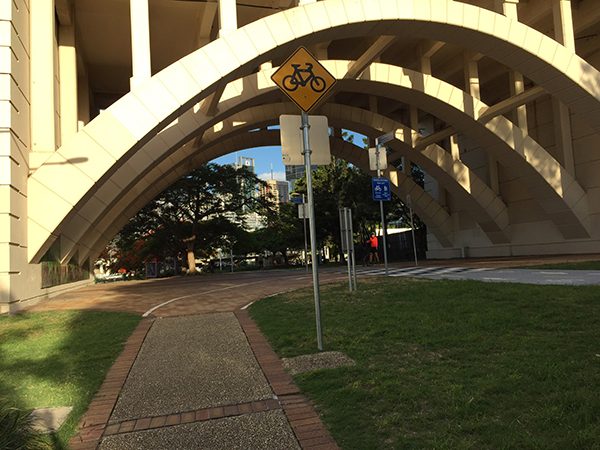 Bicycle path, Brisbane, Australia. Image Credit: iRAP
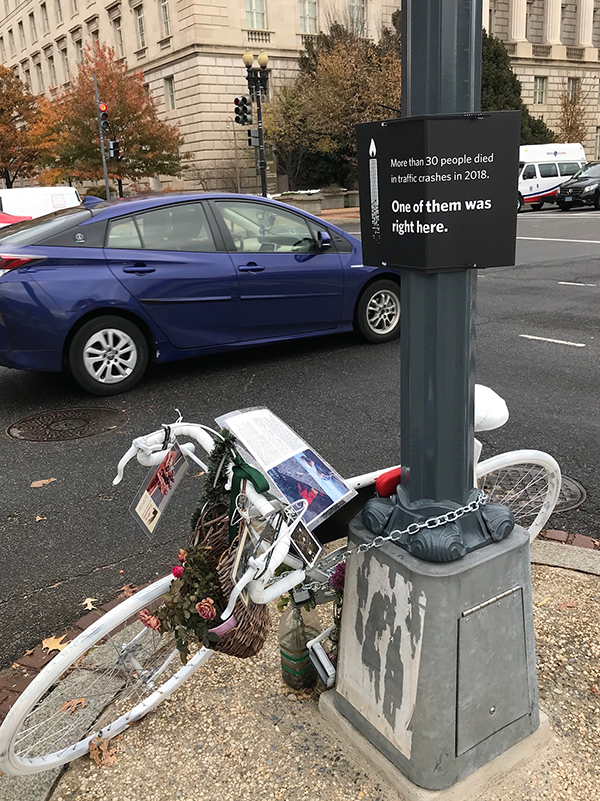 Bicyclist fatality - Washington DC, USA. Image credit: iStock
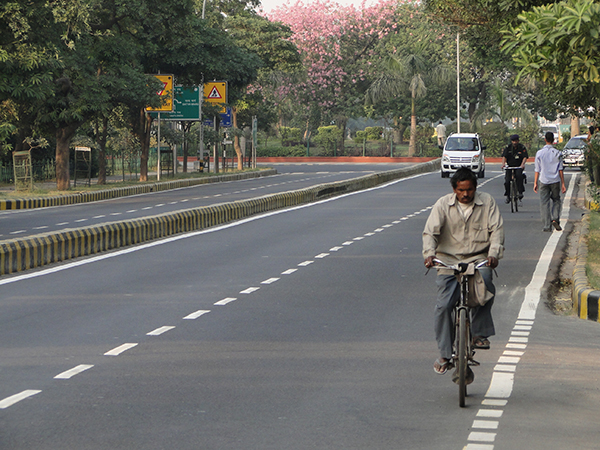 Bicyclist in India. Image credit: Greg Smith
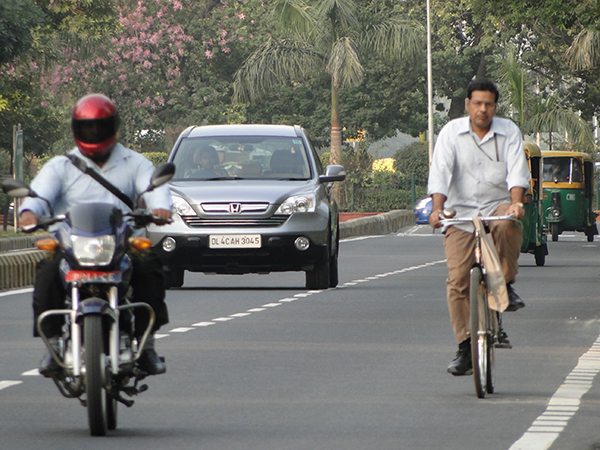 Bicyclist in India. Image credit: Greg Smith
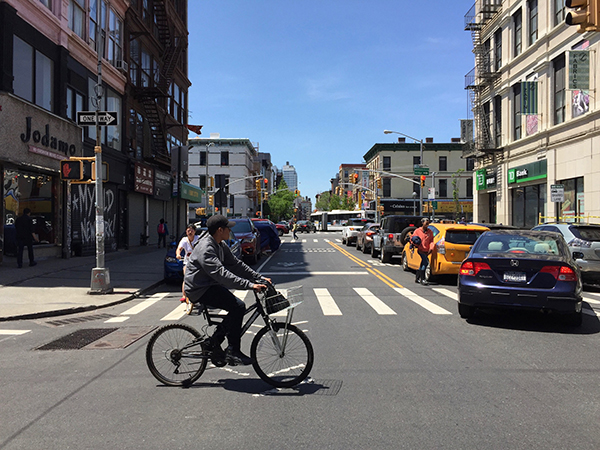 Bicyclist in USA. Image credit: Unknown
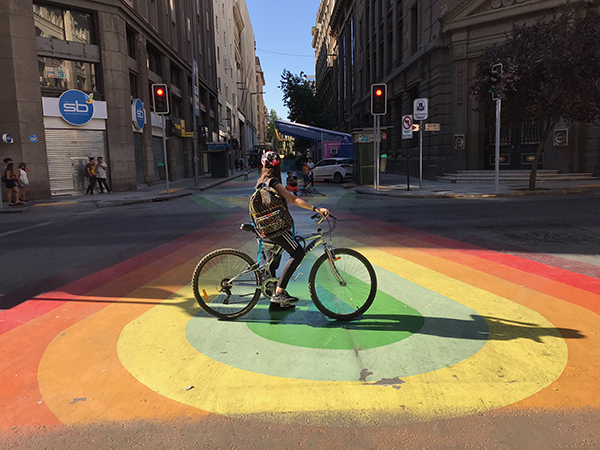 Bicyclist in Santiago, Chile. Image Credit: iRAP
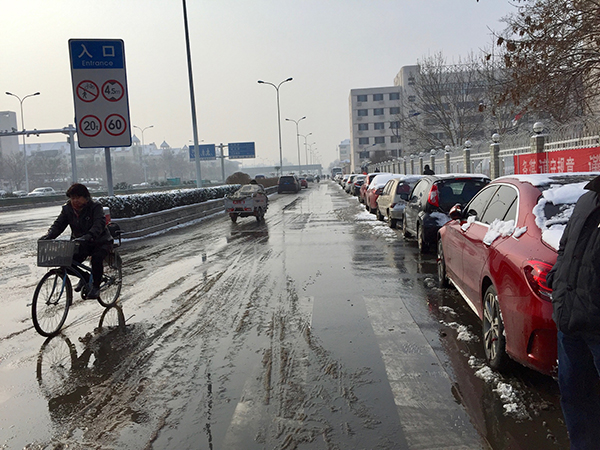 Bicyclist in Tianjin, China. Image Credit: iRAP
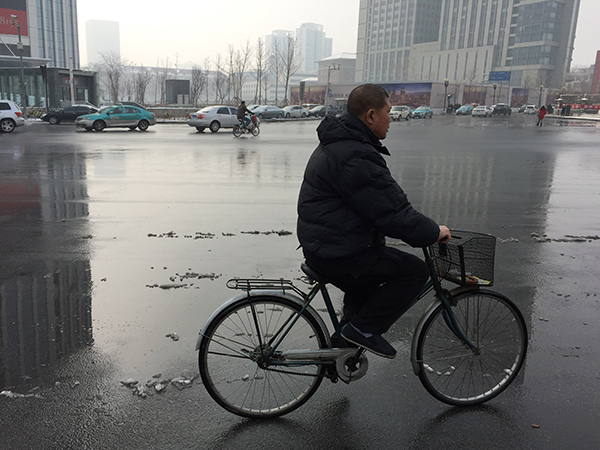 Bicyclist in Tianjin, China. Image Credit: iRAP
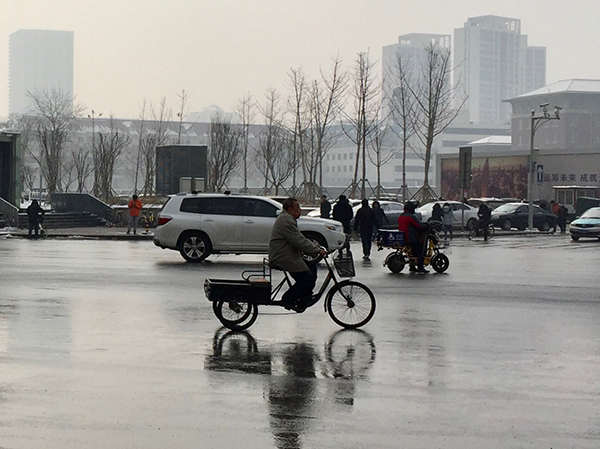 Bicyclist in Tianjin, China. Image Credit: iRAP
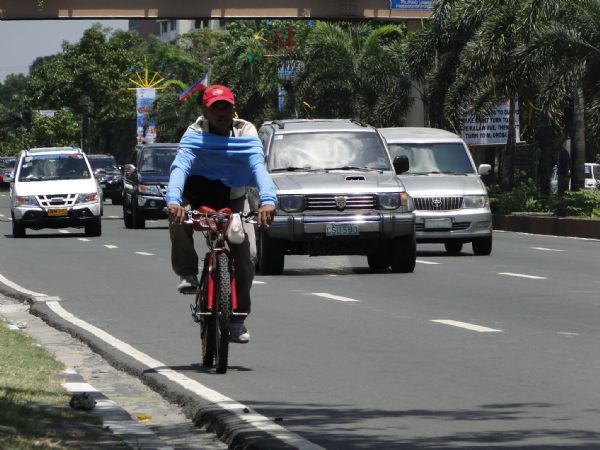 Bicyclist - Roxas Blvd Manila Philippines. Image credit: Greg Smith
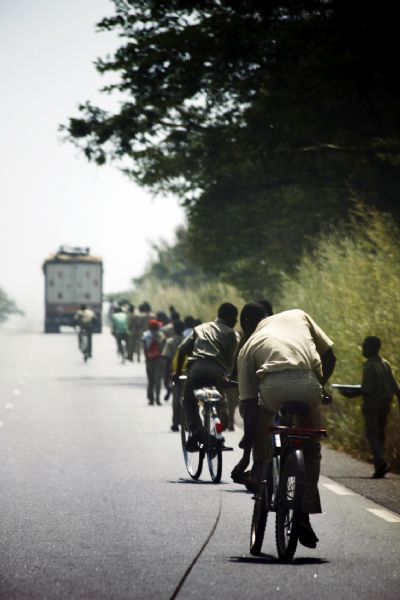 Bicyclists in Africa. Image credit: iStock
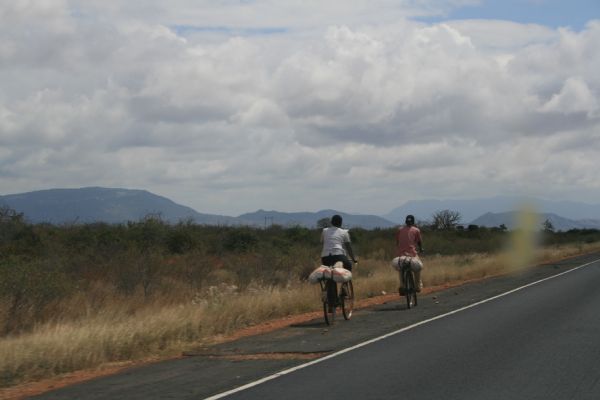 Bicyclists in Kenya. Image credit: John Mumford
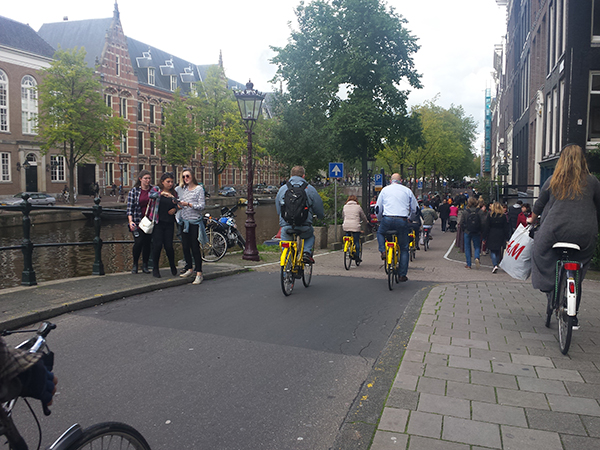 Bicyclists in the Netherlands. Image credit: Alina Burlacu
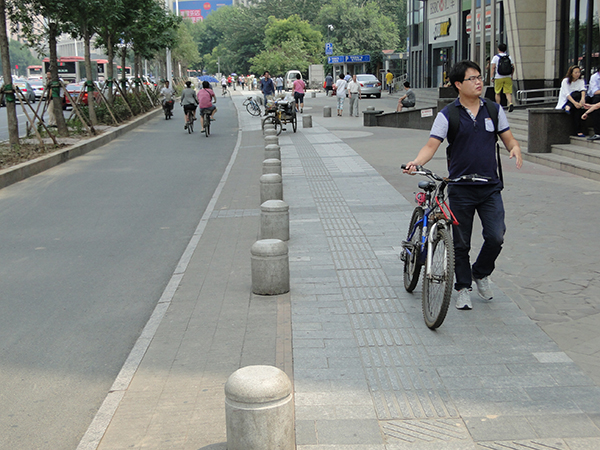 Bollards protect a sidewalk in China. Image credit: Greg Smith
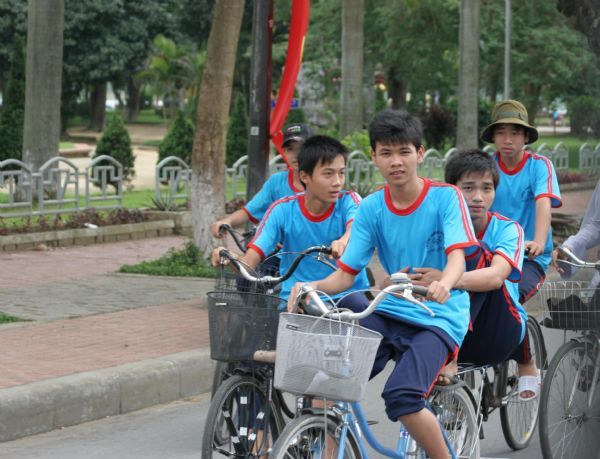 Children on bicycles in Vietnam. Image credit: Greg Smith
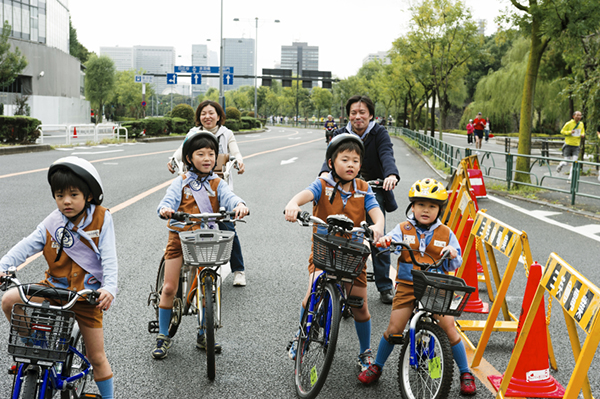 Children on bicycles. Image credit: iStock
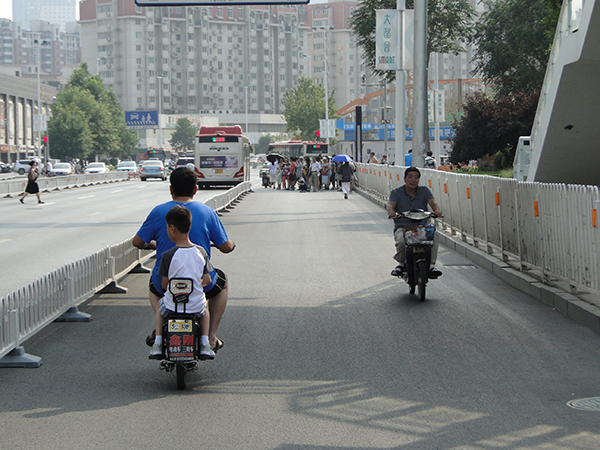 E-bike riders - China. Image credit: iRAP
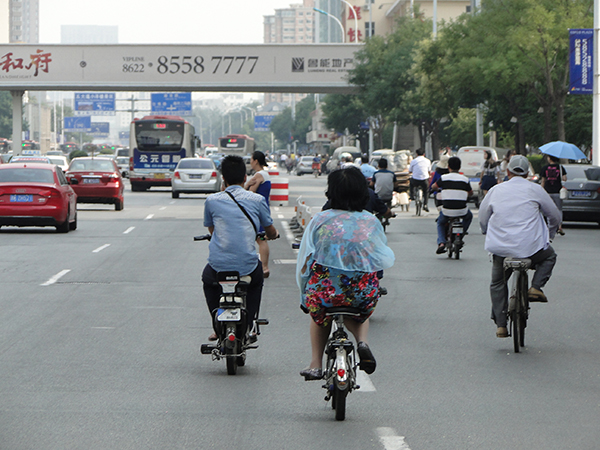 E-bike riders - China. Image credit: iRAP
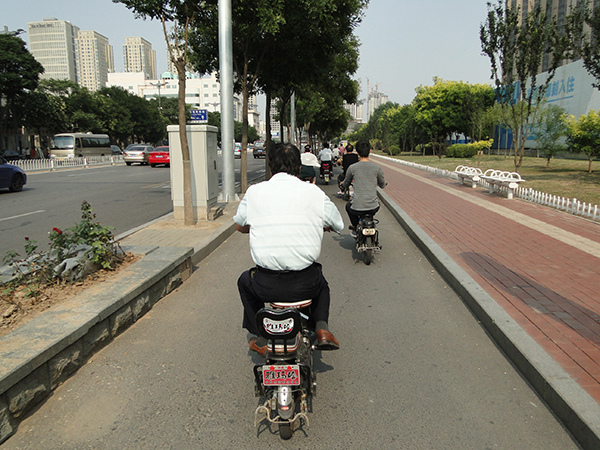 E-bikes on a bicycle lane in China. Image credit: iRAP
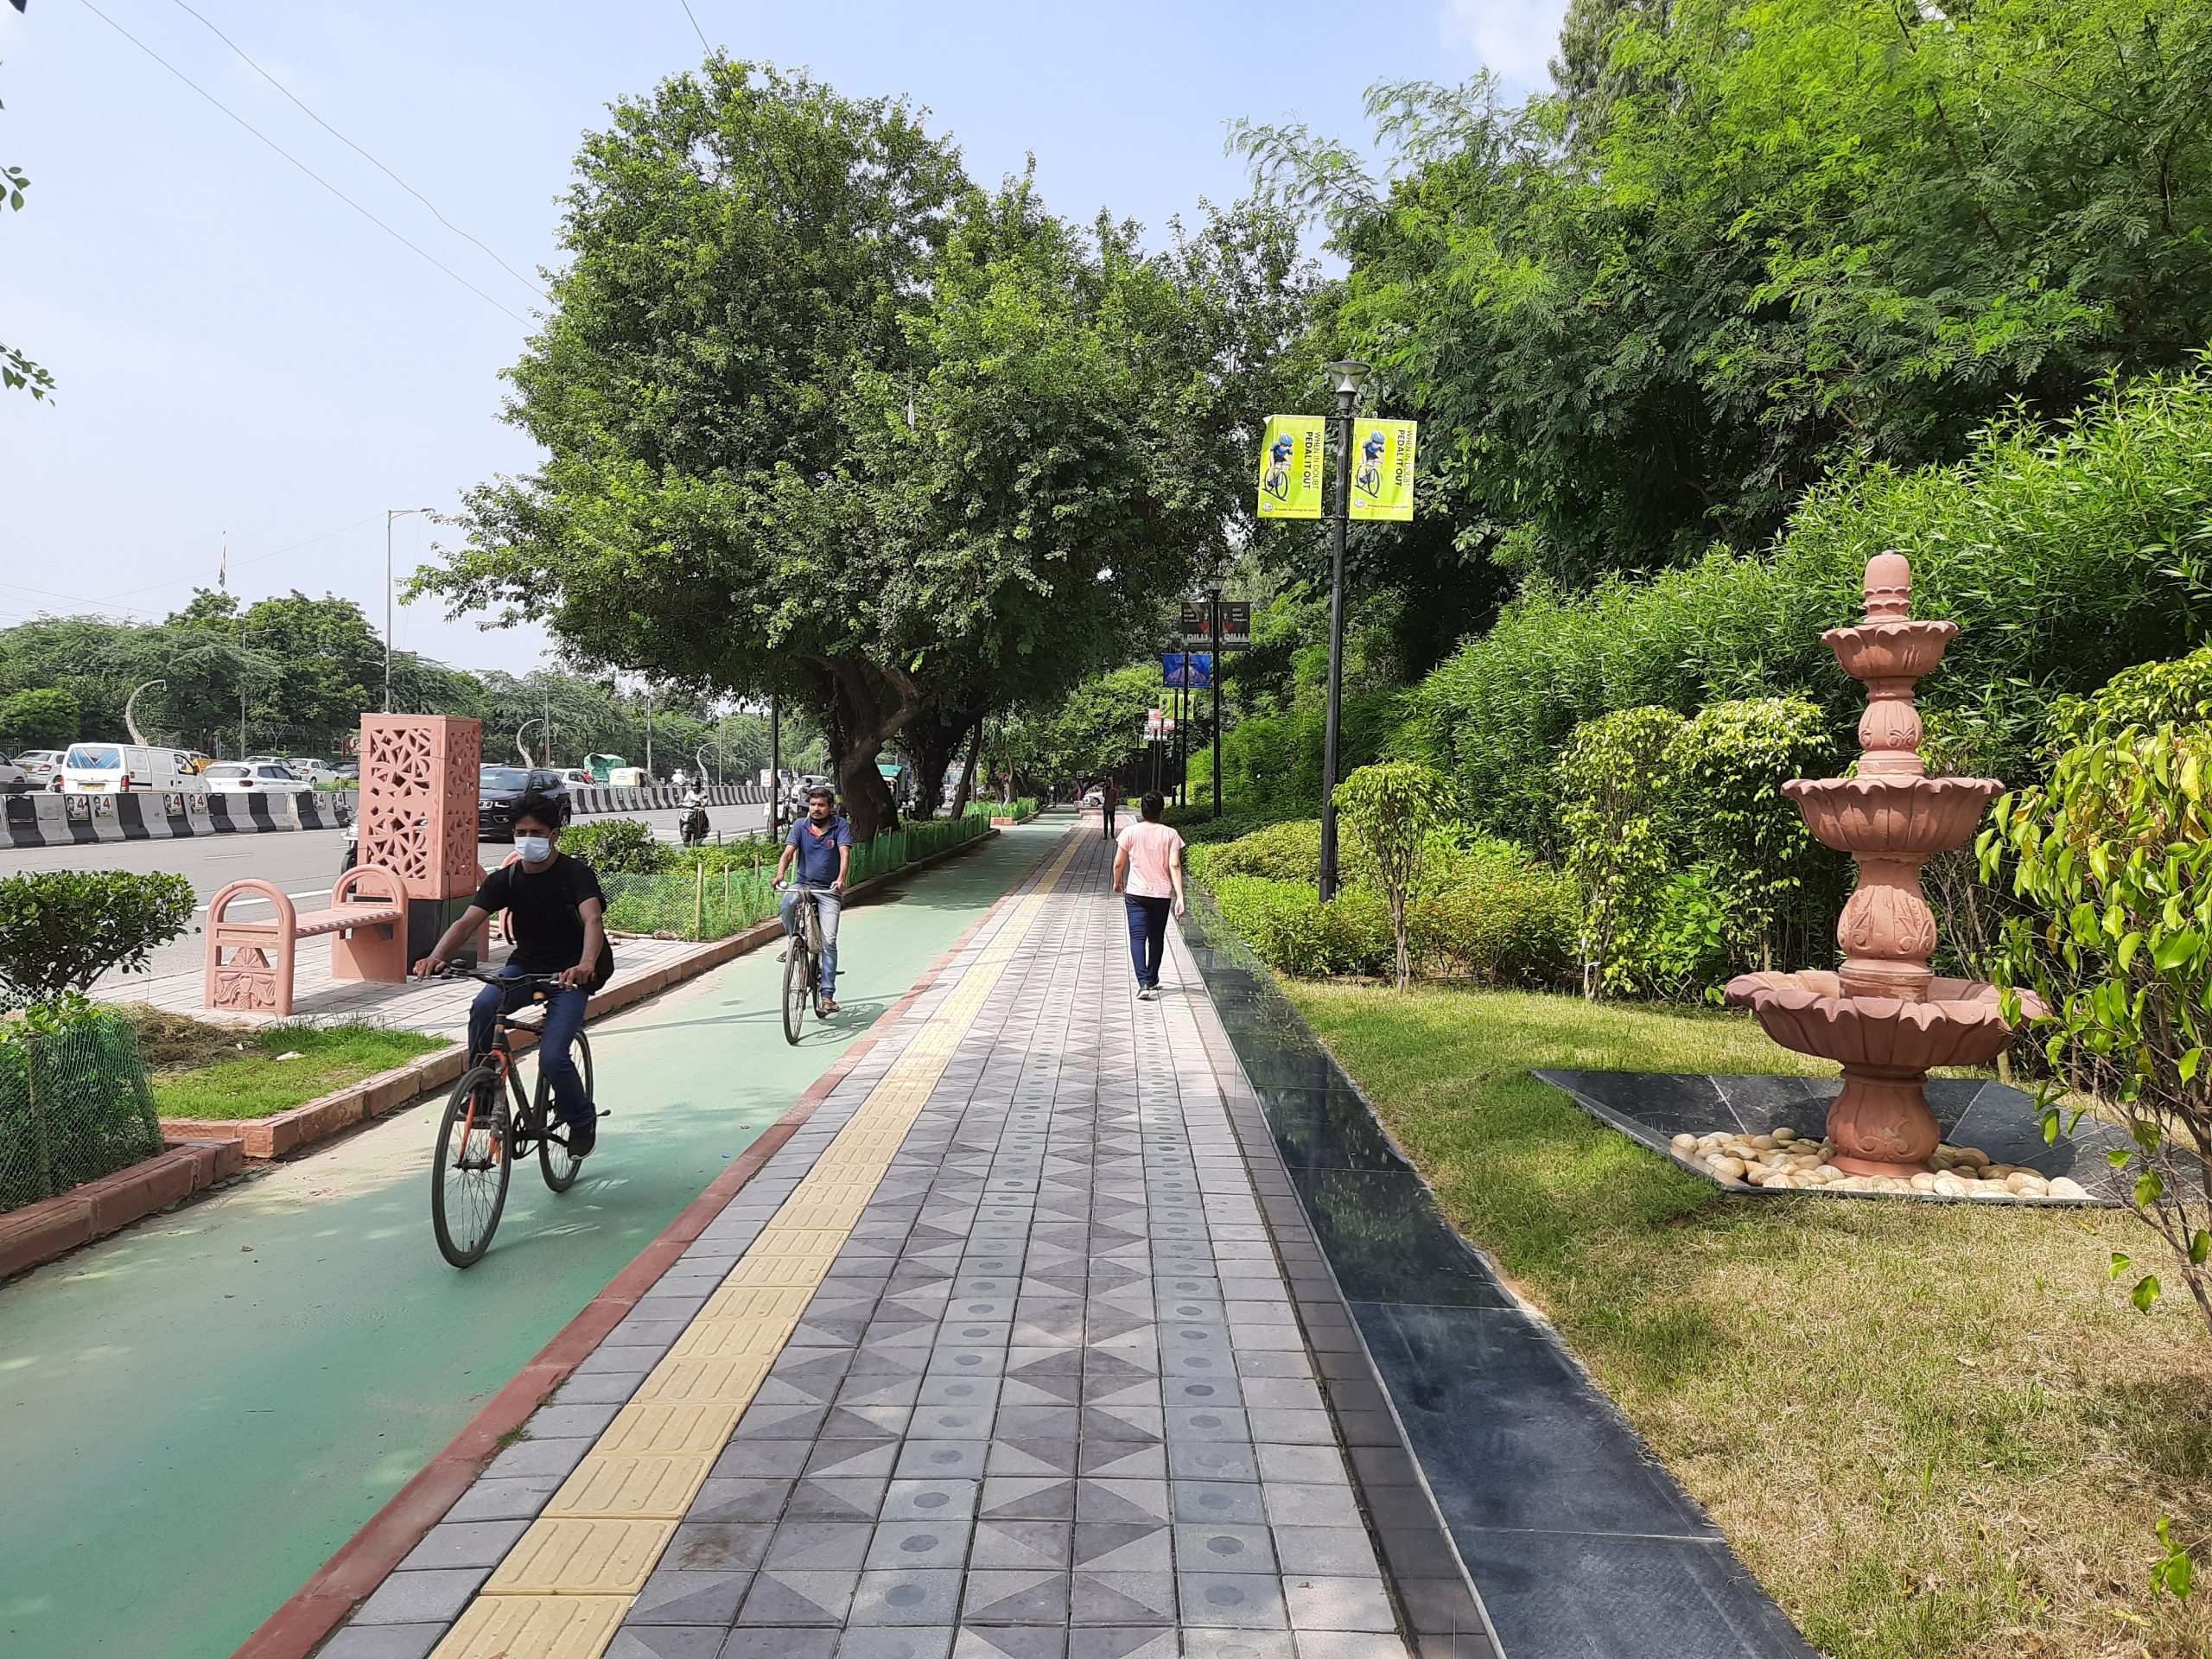 Exclusive bicycle lane and pedestrian footpath in New Delhi India. Image credit: iRAP
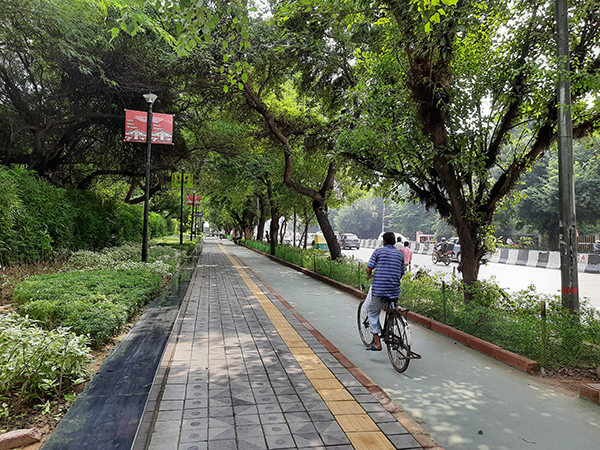 Exclusive bicycle lane and pedestrian footpath in New Delhi India. Image credit: iRAP
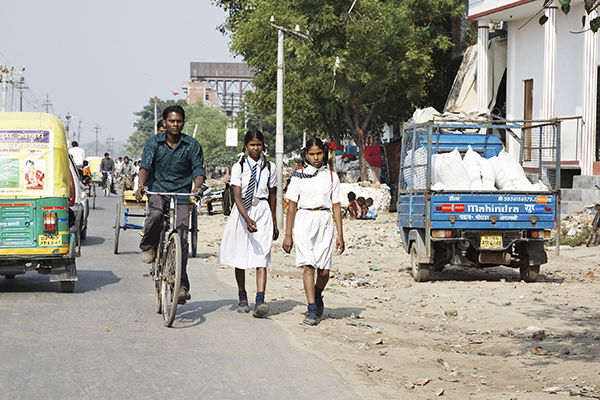 Pedestrians in India. Image Credit: iStock
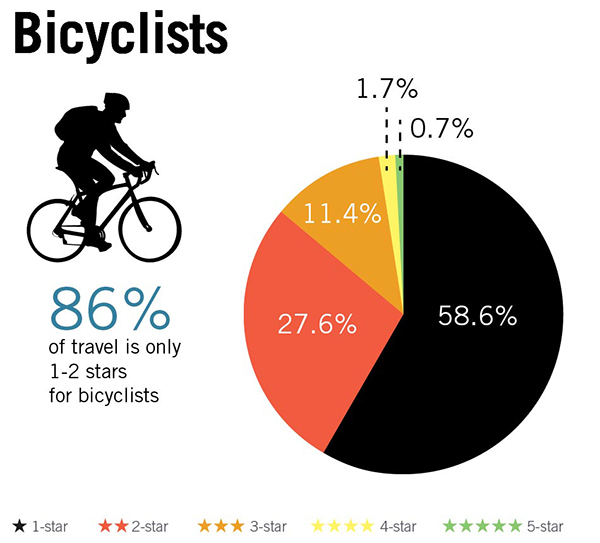 Bicyclist Star Ratings by road user type based on a 358,000km sample of roads across 54 countries. Image credit: iRAP
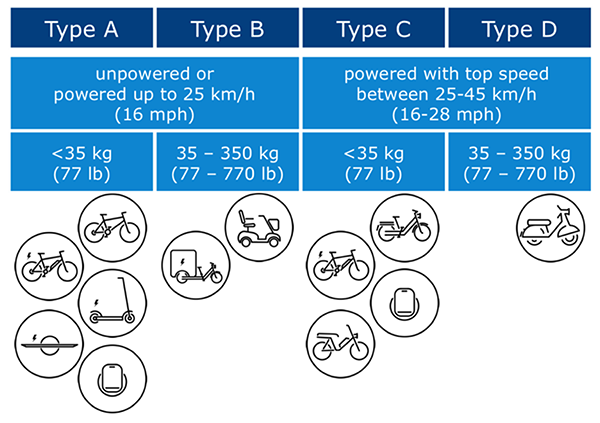 Micro-vehicles according to speed and weight. Image credit: International Transport Forum (ITF)
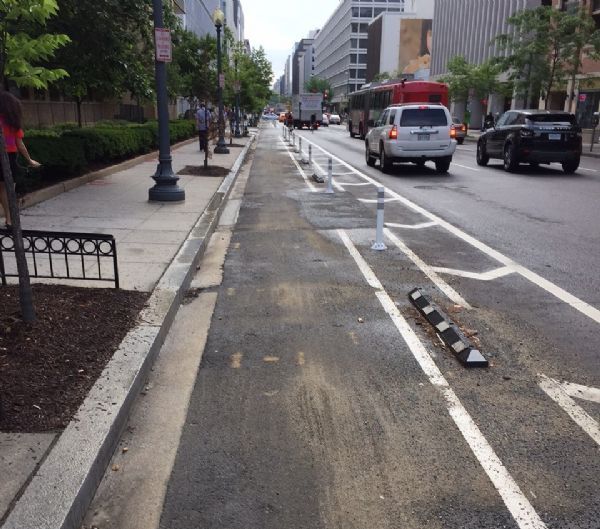 An on-road bicycle lane in US. Image credit: Greg Smith
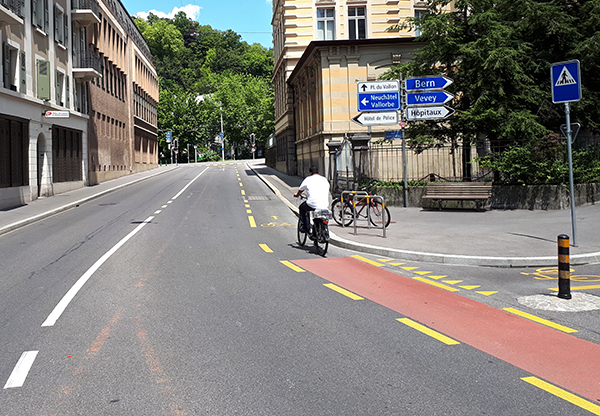 On-road dedicated bicycle lane. Image credit: Alain Rouiller
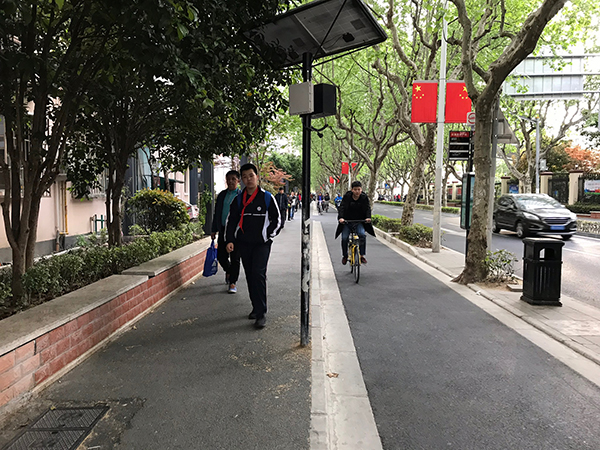 Pedestrian and bicycle facilities in Shanghai. Image credit: Unknown
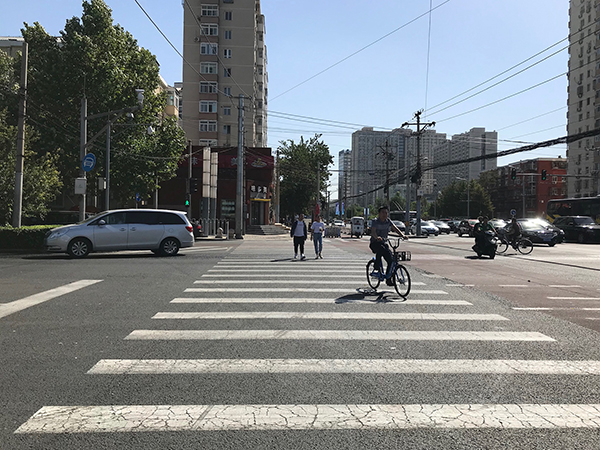 Pedestrian crossing in Beijing, China. Image Credit: iRAP
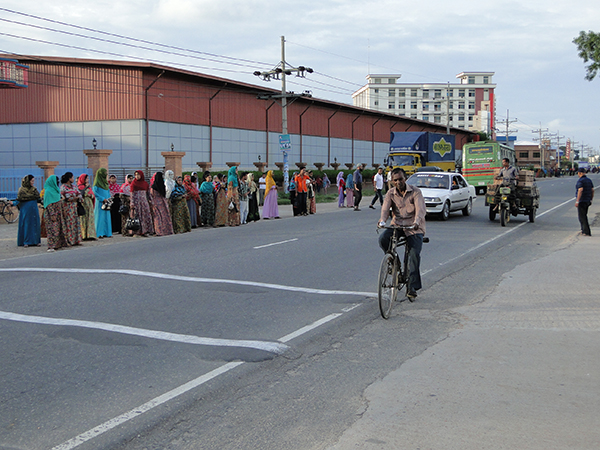 Pedestrians wait for a bus in Bangladesh. Image credit: Greg Smith
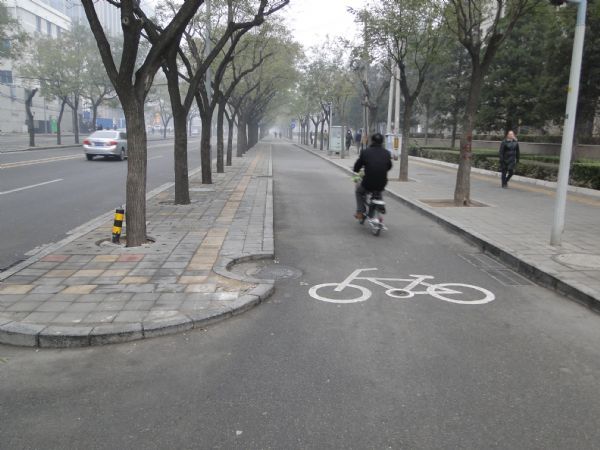 Protected bicycle lane in China. Image credit: Greg Smith
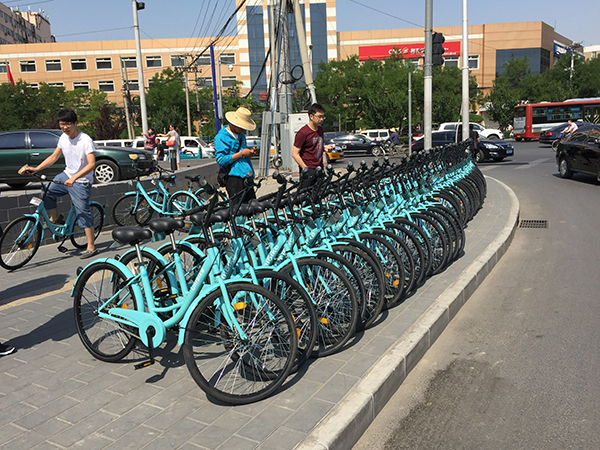 Share bikes in Beijing, China. Image Credit: iRAP
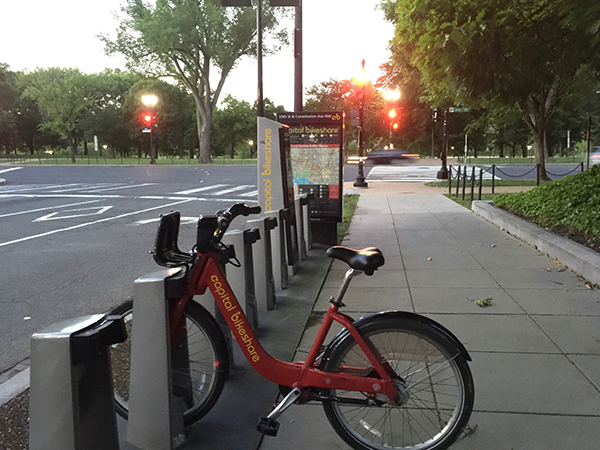 Share bikes in Washington DC, USA. Image Credit: iRAP
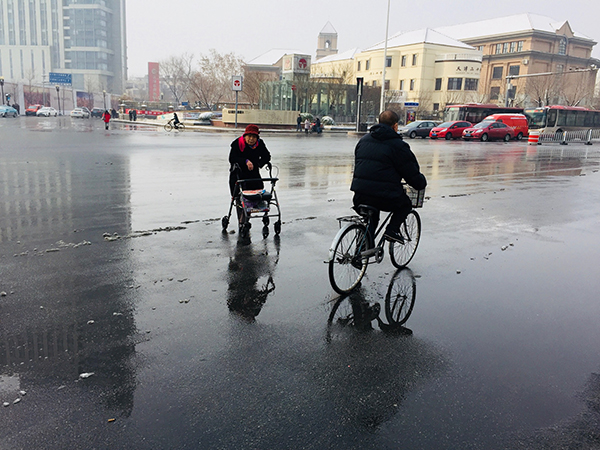 Bicyclists in an intersection with poor delineation in Tianjin, China. Image Credit: Greg Smith
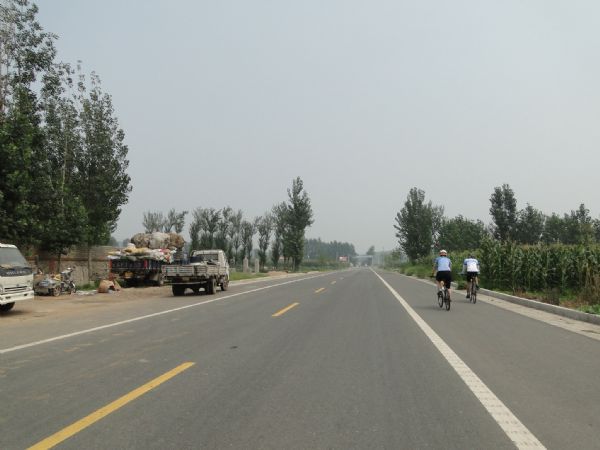 Wide sealed shoulder bicycle lane, China. Image credit: Greg Smith


