


Pedestrians
Pedestrians are vulnerable road users. In many countries, collisions with pedestrians are a leading cause of death and injury. In some countries, over half of all road deaths are caused by collisions between vehicles and pedestrians.
Pedestrians are struck by vehicles in a number of situations, including while:
- Trying to cross the road.
- Walking along the roadside, or on the road.
- Playing or working on the road.
- On driveways or footpaths.
- While boarding or leaving public transport vehicles.
Pedestrians can also be struck by bicycles.
The severity of pedestrian crashes is strongly dependent on the speed of traffic. Research shows that the chances of a pedestrian surviving an impact with a motorised vehicle reduces dramatically above 30 km/h, and even at lower speeds than this, serious harm can be caused, especially to elderly or child pedestrians.
Typical factors which may add to pedestrian crash risk include:
- Inappropriate speeds.
- Lack of footpaths and pedestrian crossings
- Lack of pedestrian crossing opportunities (gaps in passing traffic).
- Number of lanes to cross (risk is added with each lane).
- Complexity and unpredictability of traffic movements at intersections.
- Inadequate separation of footpaths from traffic.
- Poor street lighting.
- Lack of sight distance.
- Driver/rider fatigue.
- Alcohol/drugs/medication
- Distraction, including inattention due to mobile phone use.
- Lack of vehicle safety devices.
- Poor condition of vehicle tyres, lights, and brakes.
Safer Roads
Safer Vehicles
Safer People
Safer Roads
| Name | Cost rating | Effectiveness |
|---|---|---|
| Central Hatching | Low | 10 – 25% |
| Parking Improvements | Low to Medium | 10 – 25% |
| Pedestrian Crossing – Grade Separation | High | 60% or more |
| Pedestrian Crossing – Signalised | Medium | 25 – 40% |
| Pedestrian Crossing – Unsignalised | Low | 25 – 40% |
| Pedestrian Fencing | Low | 25 – 40% |
| Pedestrian Footpath | Low to Medium | 40 – 60% |
| Pedestrian Refuge Island | Low to Medium | 25 – 40% |
| Restrict/Combine Direct Access Points | Medium to High | 25 – 40% |
| School Zones | Low to Medium | 10 – 25% |
| Service Road | High | 25 – 40% |
| Paved Shoulder | Medium | 25 – 40% |
| Sight Distance (obstruction removal) | Low to Medium | 25 – 40% |
| Speed Management | Medium | 25 – 40% |
| Street Lighting | Medium | 10 – 25% |
| Traffic Calming | Medium to High | 25 – 40% |
Safer Vehicles
| Name | Cost rating | Effectiveness |
|---|---|---|
| New Car Assessment Program (NCAP) | – | – |
Safer People
| Name | Cost rating | Effectiveness |
|---|---|---|
| Addressing Alcohol and Other Drugs | – | – |
| Child Safety Initiatives | – | – |
| Education | – | – |
| Enforcement | – | – |
| Publicity | – | – |
| Safe Speed | – | – |
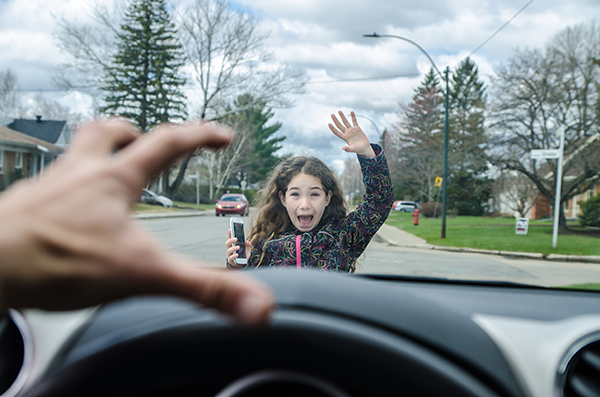 A child pedestrian crash. Image credit: iStock
 A pedestrian crash. Image credit: iStock
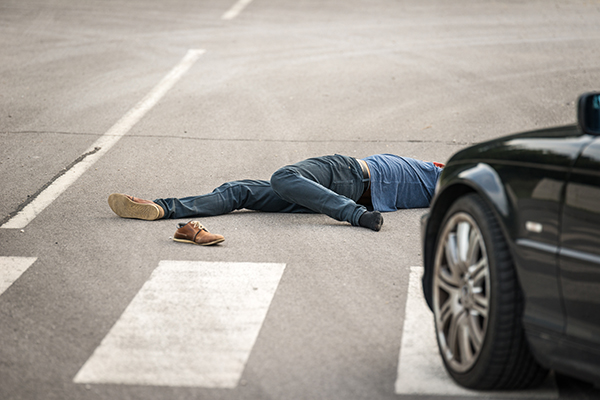 A pedestrian hit by a car. Image credit: iStock
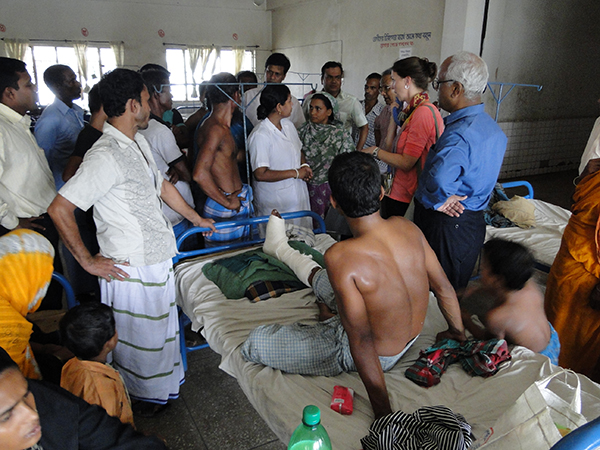 A road crash victim in Bangladesh. Image credit: Greg Smith
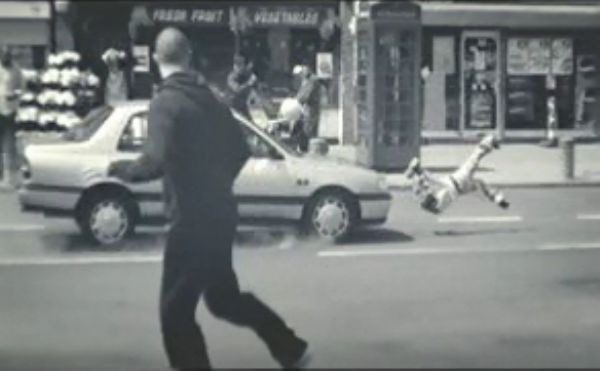 A vehicle-pedestrian crash. Image credit: 'Speed Kills' advertisement, Department for Transport, UK
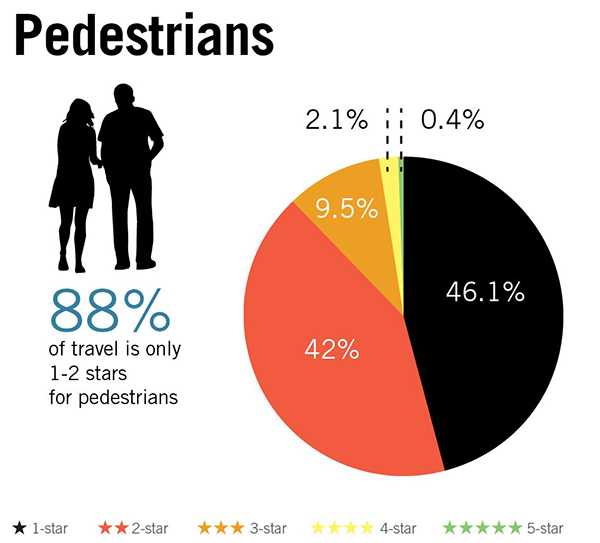 Pedestrian Star Ratings by road user type based on a 358,000km sample of roads across 54 countries. Image credit: iRAP
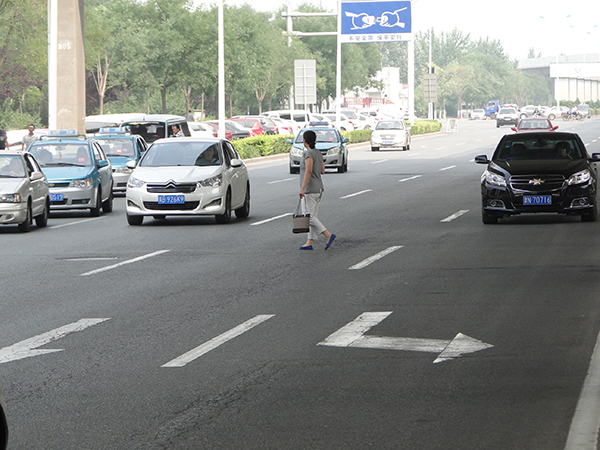 Pedestrian crossing busy multilane road in China. Image credit: Greg Smith
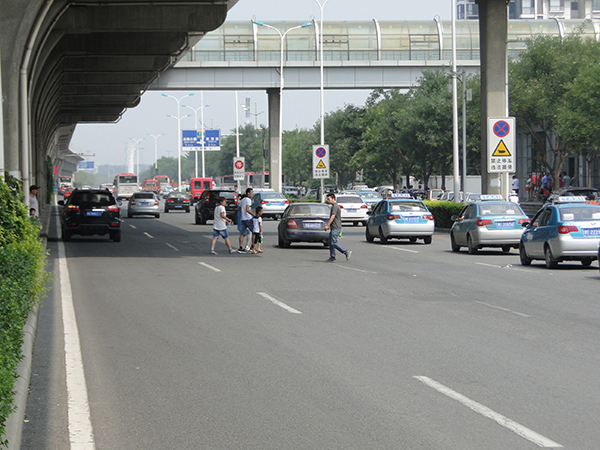 Pedestrians cross busy multilane road underneath a pedestrian bridge in China. Image Credit: Greg Smith
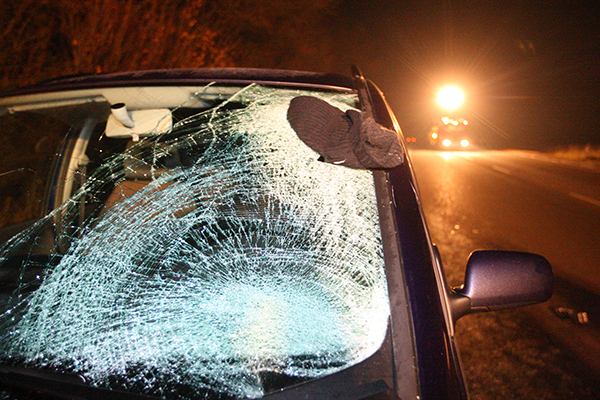 The aftermath of a car hitting a pedestrian. Image credit: iStock


