


Public Transport Vehicles
Investment in public transport systems to facilitate safe and efficient movement of large and growing populations is central to addressing demand for travel. Public transport systems reduce exposure to crashes and are a key avenue to improve safety.
There is a wide variety of vehicles used for the transportation of passengers and their goods on roads such bicycle rickshaws, motorcycles and motorised rickshaws, cars (including taxis), mini-vans, buses and trucks. Each vehicle type has its own specific safety issues, but one issue in common is that crashes involving such vehicles often result in multiple injuries and deaths (up to 80 or more in some regions with overloaded buses).
In general, bus passengers may be vulnerable as they are unrestrained and lightly protected due to typical fragility of the body structure of these vehicles. Buses colliding with rigid objects or other heavy vehicles can result in severe deformation at the impact points. Where a bus in involved in rollover or falling from height, the consequences can be catastrophic. Bus passengers may also be susceptible to loss of balance during acceleration, braking, negotiation of bends and in a collision. Passengers may fall or collide with rigid features inside the bus, leading to potential serious injuries.
Extra care in the design of the road environment needs to be taken at pick-up and drop-off locations to ensure that vehicles can and re-enter traffic flows safely and that passengers have access to accessible footpaths and pedestrian crossings.
Fares are often low, so operators of public transport often work long hours to stay in business and risk becoming fatigued. They might also drive at fast speeds to compete with other operators, and may make sudden and frequent stops to pick up passengers, each of which adds risk.
When not well managed, public transport vehicles may be of risk to other road users, especially pedestrians and bicyclists. This is particularly so as the size of the vehicle increases.
Vehicle technologies should be equipped in public transport vehicles to help reduce conflicts with other vehicles and road users. For example, in London, buses are fitted with Intelligent Speed Assistance (ISA) to help control the speed on the bus network and make it safer for those that use the roads.
Although driver and vehicle defects have a significant role in public transport vehicle crashes, there are many road related factors that also influence risk. It is often easier and cheaper to improve safety through a change to the road environment than it is to change driver behaviour, so improvements in the road system are an important means of improving road safety.
Road related contributing factors to crashes include:
- inappropriate speeds
- lack of facilities at drop-off and pick-up points (especially for pedestrians)
- uncontrolled movements and turns, especially at intersections and access point)
- lack of separation of vehicles or road users of different size (e.g. lack of facilities for pedestrians and cyclists)
- lack of separation for vehicles travelling in different directions (e.g. lack of median barriers)
- lack of advanced warning of hazards
- inadequate information to enable road users to negotiate the roadway safely
- presence of hazards, particularly at the roadside (e.g. utility poles and trees)
- poor road surface.
| Name | Cost rating | Effectiveness |
|---|---|---|
| Additional Lane | High | 25 – 40% |
| Central Hatching | Low | 10 – 25% |
| Central Turning Lane Full Length | Low | 10 – 25% |
| Delineation | Low | 10 – 25% |
| Duplication | High | 25 – 40% |
| Intersection – Delineation | Low | 10 – 25% |
| Intersection – Grade Separation | High | 25 – 40% |
| Intersection – Roundabout | Low to Medium | 60% or more |
| Intersection – Signalise | Medium | 25 – 40% |
| Intersection – Turn Lanes (Signalised) | Low to Medium | 10 – 25% |
| Intersection – Turn Lanes (Unsignalised) | Low to Medium | 10 – 25% |
| Lane Widening | Medium to High | 25 – 40% |
| Median Barrier | Medium to High | 60% or more |
| Median Crossing Upgrade | Low to Medium | 25 – 40% |
| One Way Network | Medium | 25 – 40% |
| Parking Improvements | Low to Medium | 10 – 25% |
| Railway Crossing | Medium | 60% or more |
| Realignment – Horizontal | High | 25 – 40% |
| Realignment – Vertical | High | 10 – 25% |
| Regulate Roadside Commercial Activity | Low to Medium | 10 – 25% |
| Restrict/Combine Direct Access Points | Medium to High | 25 – 40% |
| Road Surface Rehabilitation | Medium | 25 – 40% |
| Roadside Safety – Barriers | Medium | 40 – 60% |
| Roadside Safety – Hazard Removal | Low to Medium | 25 – 40% |
| Rumble Strips | Low | 10 – 25% |
| Service Road | High | 25 – 40% |
| Paved Shoulder | Medium | 25 – 40% |
| Skid Resistance | Low to Medium | 25 – 40% |
| Speed Management | Medium | 25 – 40% |
| Traffic Calming | Medium to High | 25 – 40% |
| Name | Cost rating | Effectiveness |
|---|---|---|
| Motor Vehicle Standards | – | – |
| Name | Cost rating | Effectiveness |
|---|---|---|
| Addressing Alcohol and Other Drugs | – | – |
| Education | – | – |
| Emergency Response | – | – |
| Enforcement | – | – |
| Licensing | – | – |
| Publicity | – | – |
| Safe Speed | – | – |
Related Images
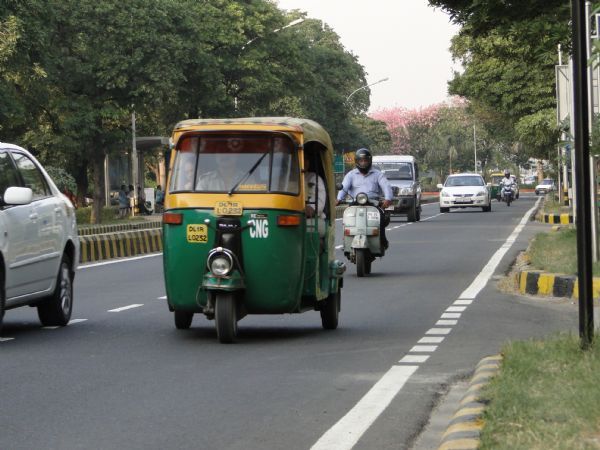 A three wheel rickshaw in New Delhi, India Image credit: iRAP
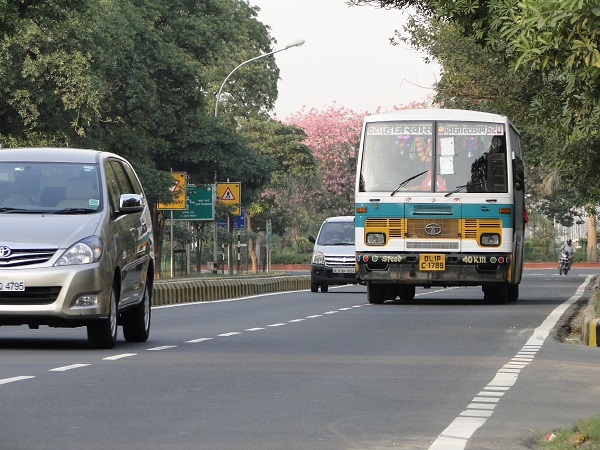 Bus in India. Image credit: Greg Smith
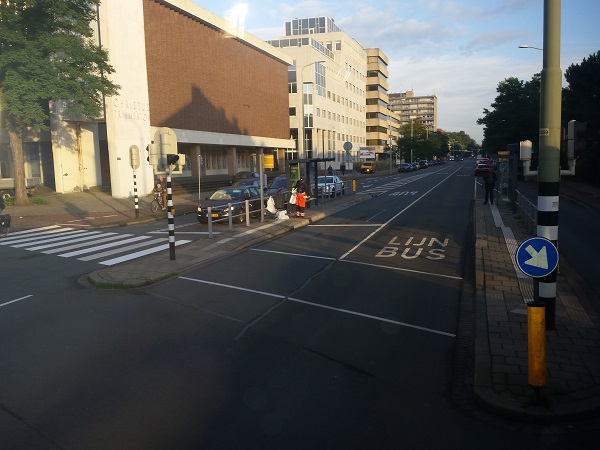 Bus lanes in the Netherlands. Image credit: Alina Burlacu
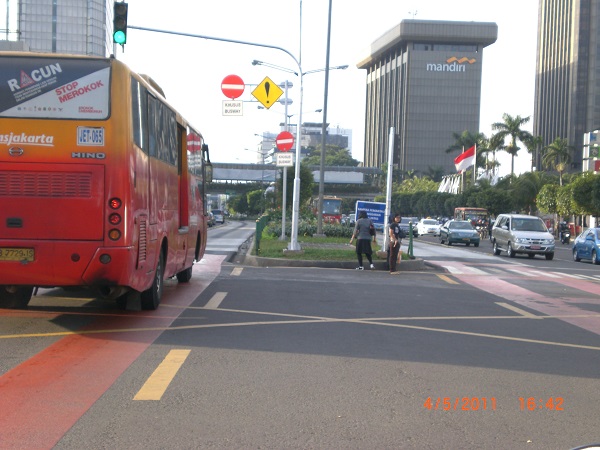 Bus rapid transit in Indonesia. Image credit: iRAP
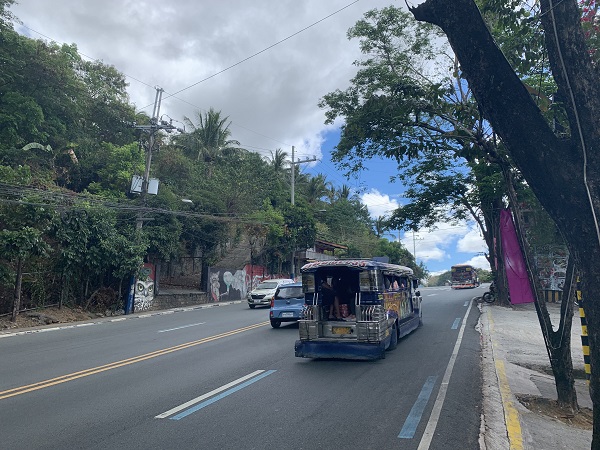 Jeepney in the Philippines. Image credit: Alina Burlacu
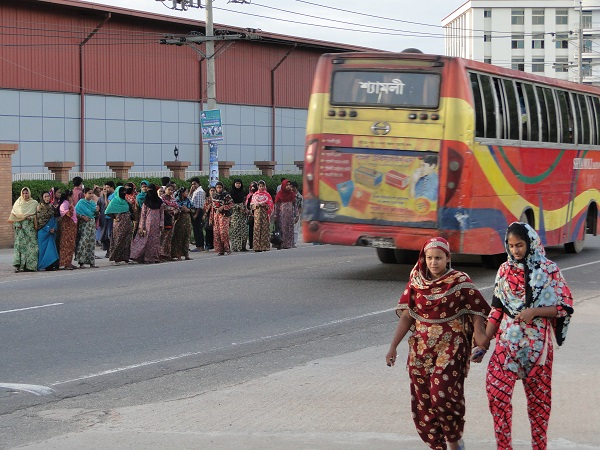 Public transport in Bangladesh. Image credit: Greg Smith
 Public transport in China (School children). Image credit: Monica Olyslagers
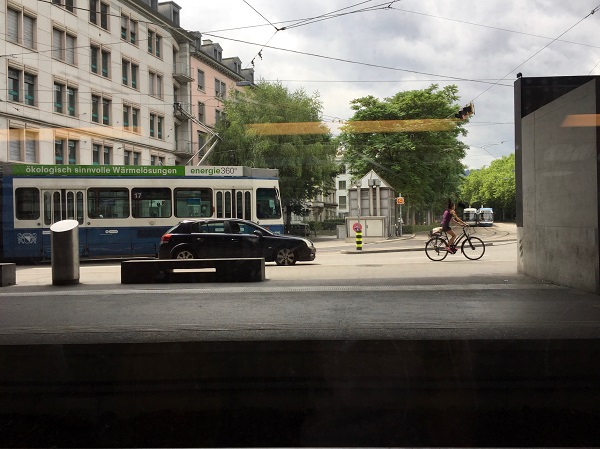 Public Transport in Switzerland. Image credit: iRAP
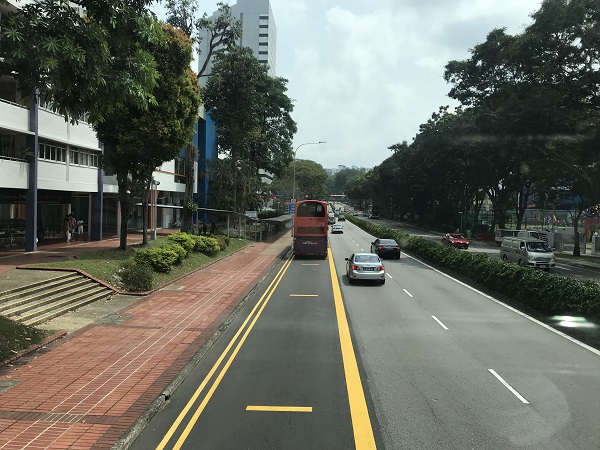 Raised pedestrian crossing in Singapore. Image credit: Alina Burlacu
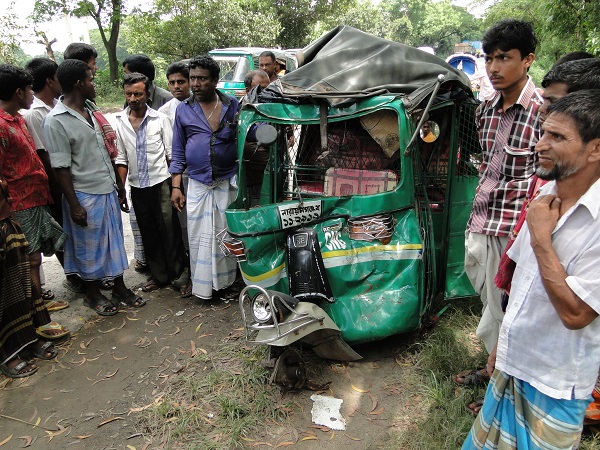 The aftermath of a head on crash in Bangladesh. Image credit: Greg Smith

