


Car Occupants
Car use is growing rapidly in many countries. The resultant increase in interaction between cars, heavy vehicles (such as trucks or buses) and vulnerable road users often leads to conflicts and more crashes.
Car occupants are also at risk themselves, particularly in higher speed environments. Even in the most modern of vehicles, the chance of surviving a side impact with a tree or post reduces dramatically above 30 km/h, while the chances of survival are low above 70 km/h for a head-on crash with a similar vehicle. For less modern vehicles, or in collisions with vulnerable road users, survival speeds in a collision are far less.
While people will always makes mistakes, there are many road related factors that influence the risk of crashes. It is often easier, cheaper and more effective to improve safety through a change to the road environment than it is to change driver behaviour, so improvements in the road system are an important means of improving road safety.
Road related contributing factors to crashes include:
- inappropriate speeds.
- uncontrolled movements and turns, especially at intersections and access points.
- lack of separation of vehicles or road users of different size (e.g. lack of facilities for pedestrians and cyclists).
- lack of separation for vehicles travelling in different directions (e.g. lack of median barriers).
- lack of advanced warning of hazards.
- inadequate information to enable road users to negotiate the roadway safely.
- presence of hazards, particularly at the roadside (e.g. utility poles and trees).
- poor road surface.
Case Studies
| Examples of related Case Studies |
|---|
| Sakhalin Seatbelt Campaign, Russia |
| NR-7 Road (Asprohoma) |
| The Coast Road Median Barrier |
| Por Amor – Costa Rica’s Seat Belt Campaign |
| A-375 Road |
| Name | Cost rating | Effectiveness |
|---|---|---|
| Additional Lane | High | 25 – 40% |
| Central Hatching | Low | 10 – 25% |
| Central Turning Lane Full Length | Low | 10 – 25% |
| Delineation | Low | 10 – 25% |
| Duplication | High | 25 – 40% |
| Intersection – Delineation | Low | 10 – 25% |
| Intersection – Grade Separation | High | 25 – 40% |
| Intersection – Roundabout | Low to Medium | 60% or more |
| Intersection – Signalise | Medium | 25 – 40% |
| Intersection – Turn Lanes (Signalised) | Low to Medium | 10 – 25% |
| Intersection – Turn Lanes (Unsignalised) | Low to Medium | 10 – 25% |
| Lane Widening | Medium to High | 25 – 40% |
| Median Barrier | Medium to High | 60% or more |
| Median Crossing Upgrade | Low to Medium | 25 – 40% |
| One Way Network | Medium | 25 – 40% |
| Parking Improvements | Low to Medium | 10 – 25% |
| Railway Crossing | Medium | 60% or more |
| Realignment – Horizontal | High | 25 – 40% |
| Realignment – Vertical | High | 10 – 25% |
| Regulate Roadside Commercial Activity | Low to Medium | 10 – 25% |
| Restrict/Combine Direct Access Points | Medium to High | 25 – 40% |
| Road Surface Rehabilitation | Medium | 25 – 40% |
| Roadside Safety – Barriers | Medium | 40 – 60% |
| Roadside Safety – Hazard Removal | Low to Medium | 25 – 40% |
| Rumble Strips | Low | 10 – 25% |
| School Zones | Low to Medium | 10 – 25% |
| Service Road | High | 25 – 40% |
| Paved Shoulder | Medium | 25 – 40% |
| Sight Distance (obstruction removal) | Low to Medium | 25 – 40% |
| Skid Resistance | Low to Medium | 25 – 40% |
| Speed Management | Medium | 25 – 40% |
| Traffic Calming | Medium to High | 25 – 40% |
| Name | Cost rating | Effectiveness |
|---|---|---|
| Motor Vehicle Standards | – | – |
| New Car Assessment Program (NCAP) | – | – |
| Used Car Safety Ratings | – | – |
| Safety Features and Devices | – | – |
| Vehicle Roadworthiness | – | – |
| Name | Cost rating | Effectiveness |
|---|---|---|
| Addressing Alcohol and Other Drugs | – | – |
| Education | – | – |
| Emergency Response | – | – |
| Enforcement | – | – |
| Fatigue Management | – | – |
| Licensing | – | – |
| Publicity | – | – |
| Safe Speed | – | – |
| Seatbelts | – | – |
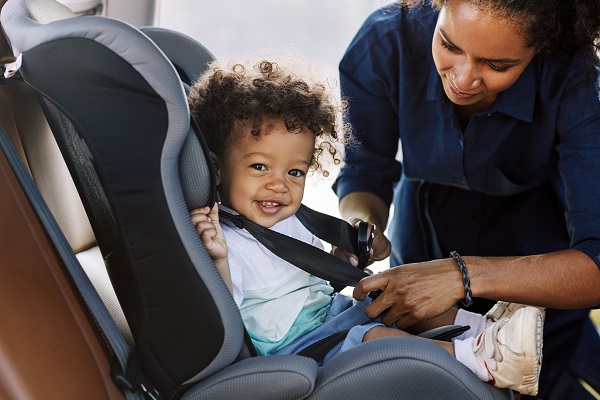 A child safety seat. Image credit: iStock
 A child safety seat. Image credit: iStock
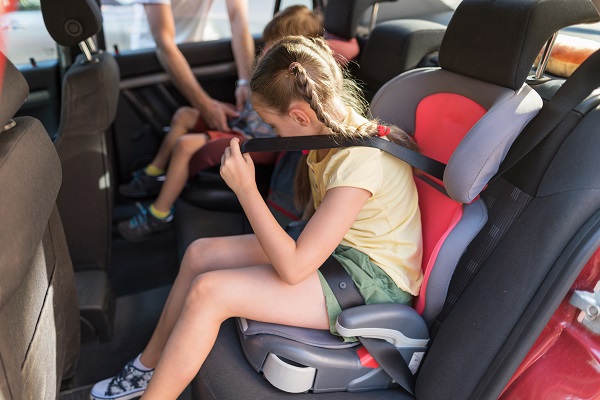 A child safety seat. Image credit: iStock
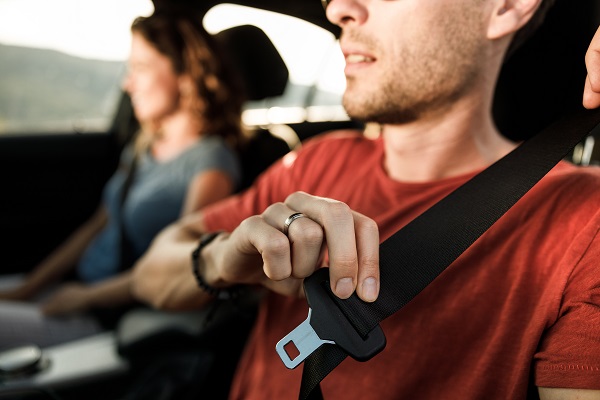 A seat belt. Image credit: iStock
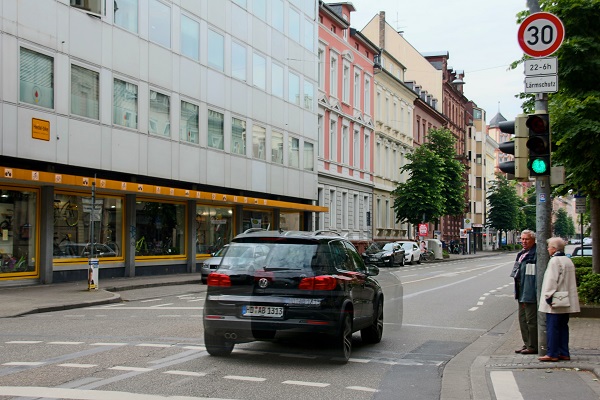 Car passing a 30km/h speed limit sign. Photo credit: RdA Suisse
 Children wearing seat belts. Image credit: iStock
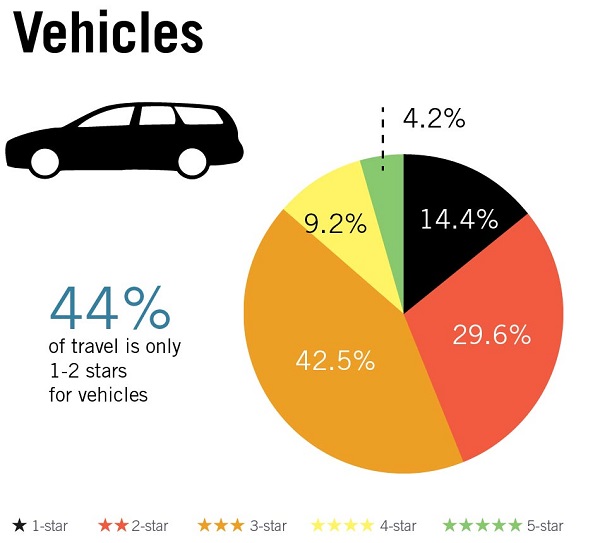 Vehicle occupant Star Ratings by road user type based on a 358,000km sample of roads across 54 countries. Image credit: iRAP
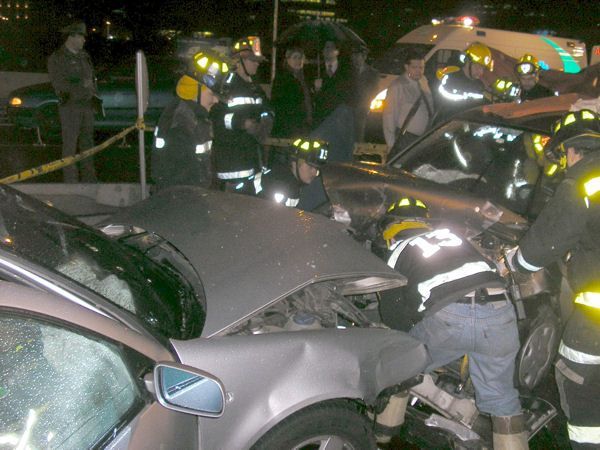 The results of a head-on crash. Image credit: iStock
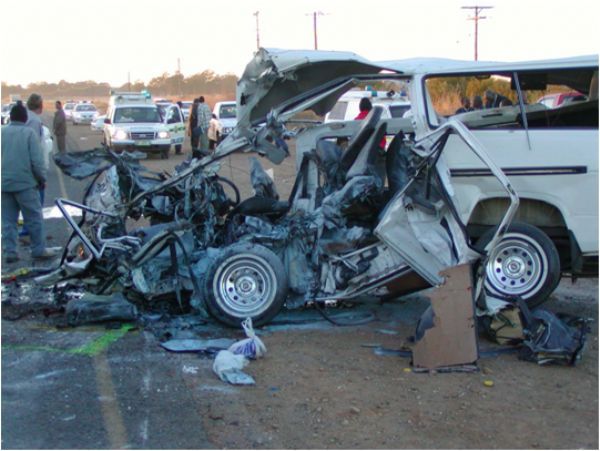 Thirteen primary school teachers were killed instantly when this minibus slammed into an oncoming truck on an undivided highway, South Africa. Image credit: North West Provincial Government


